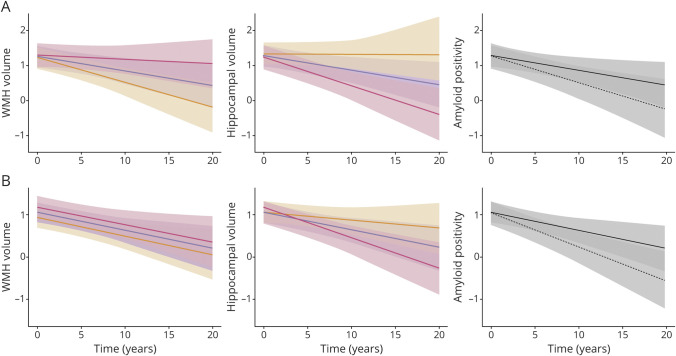
Figure 2. Plots of marginal effects of mixed regression models.
Each graph shows cognitive trajectories for various levels of a single brain measure. (A) Predictive values of episodic memory performance. (B) Predictive values of executive function performance. Y axes represent cognitive performance. X axes are time. Red line, 1.0 SD below the mean; blue line, mean; yellow line, 1.0 SD above the mean for white matter hyperintensities (WMH) and hippocampal volumes; solid black line, amyloid-negative; dotted black line, amyloid-positive.

