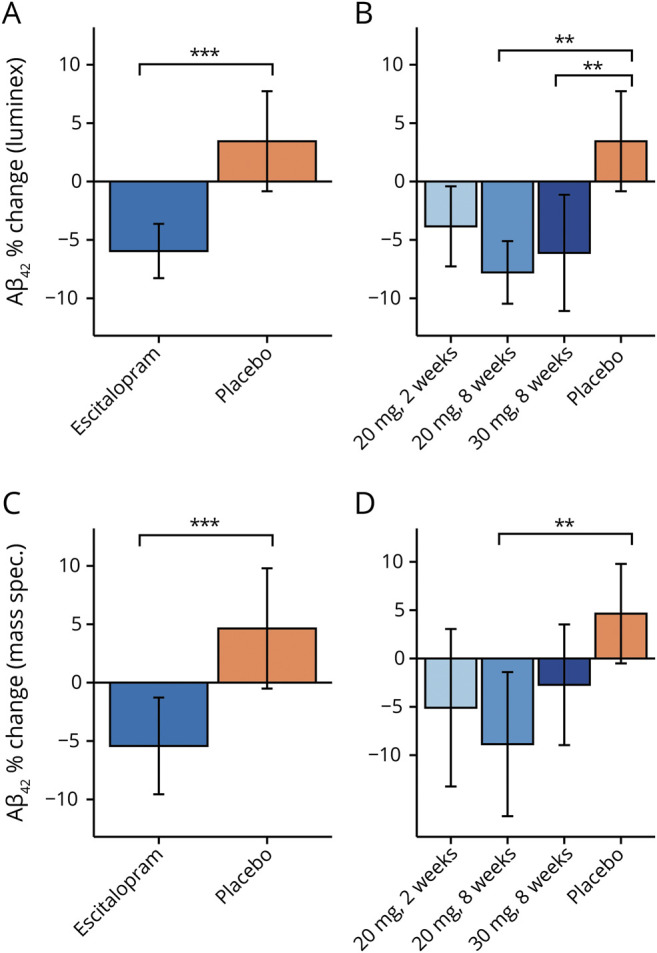
Figure 1. Effect of escitalopram on CSF β-amyloid (Aβ)42.

(A) Using the Luminex assay, the combined escitalopram group demonstrated a greater percent reduction in Aβ42 than the placebo group, with an overall difference between groups of 9.4% (F1,109 = 16.64, p < 0.001, 95% confidence interval [CI] 4.9%–14.2%, d = 0.81). On average, there was a 6.0% (SEM 1.2%) reduction of Aβ42 in the escitalopram-treated group (blue bar) vs a 3.5% (SEM 2.2%) increase in the placebo-treated group (orange bar). (B) The 20 mg 2 weeks escitalopram group (light blue bar) had a 3.8% (SEM 1.8%) reduction in Aβ42 on average (not significant compared to placebo). For the 20 mg × 8 weeks group (medium blue bar), there was a 7.8% (SEM 1.4%) average reduction. For the 30 mg × 8 weeks escitalopram group (dark blue bar), the average reduction was 6.1% (SEM 2.5%), compared with an average increase of 3.5% (2.2%) in the placebo-treated group (orange bar; Tukey adjusted p = 0.002, 95% CI 3.4%–19.5%, d = 0.94 and p = 0.007, 95% CI 2.0%–17.1%, d = 0.69, comparing placebo to the 20 mg × 8 weeks and 30 mg × 8 weeks groups, respectively). (C) Using mass spectrometry, similar results were found: overall difference in average percent change between groups of 11.1% (F1,109 = 11.593, p < 0.001, 95% CI [18.5%–4.9%, d = 0.60). See Results for details. (D) For the 20 mg × 8 weeks group (medium blue bar), there was a 10.5% (SEM 3.6%) average reduction that was significantly different than the placebo group (Tukey adjusted p = 0.001, 95% CI 5.5%–29.0%, d = 0.89). See Results for other details. All p values resulted from 2-sided statistical tests and statistical significance was set at *p < 0.05, **p < 0.01, and ***p < 0.001.
