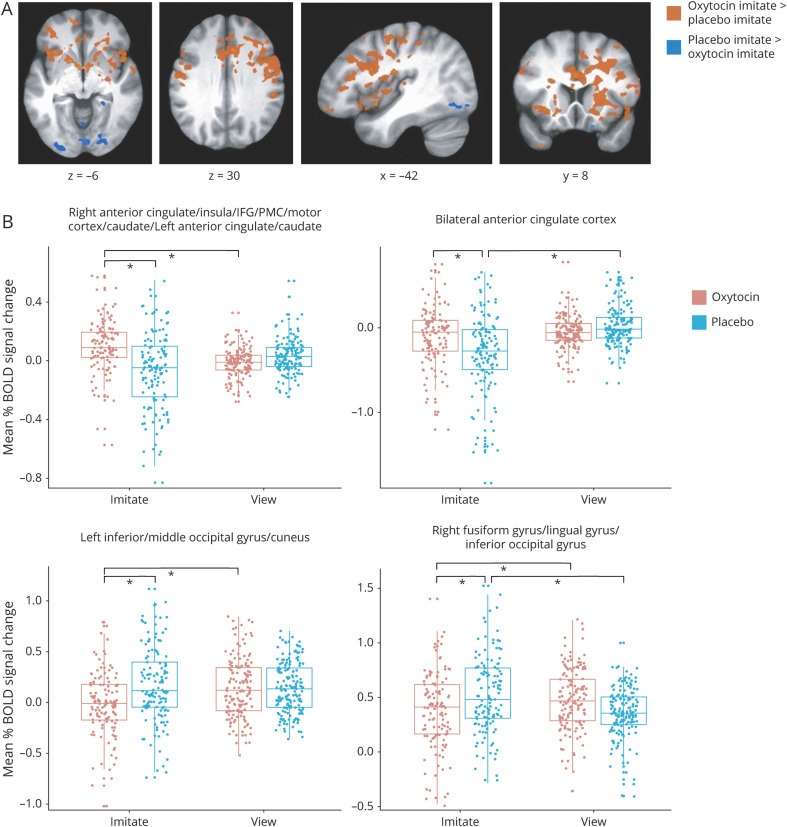
Figure 2. Interaction of treatment and condition on blood oxygen level–dependent (BOLD) signal during facial expression processing.
(A) Regions showing increased BOLD signal after oxytocin compared to placebo treatment during imitate compared to view and regions showing greater BOLD signal during placebo treatment compared to oxytocin for imitate in comparison to view. Whole-brain analyses were conducted at p < 0.001, corrected to family-wise error p < 0.05. (B) Example distributions of mean percent BOLD signal change (beta weights) during imitate and view conditions on oxytocin and placebo treatments across expressions in clusters identified in the treatment × condition interaction showing different activation patterns. Bars indicate where significant differences exist. IFG = inferior frontal gyrus; PMC = premotor cortex.

