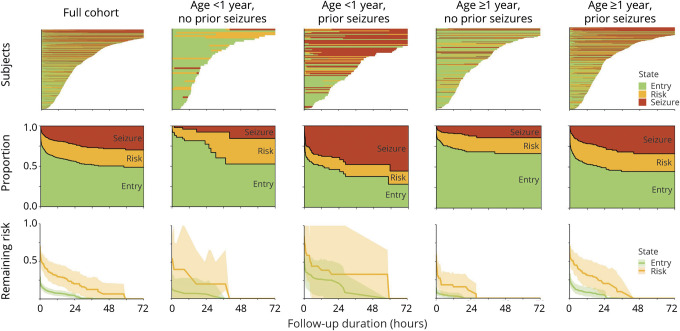
Figure 2. Swimmer plots and multistate survival analysis results for the full cohort and each clinical risk state.
Top row: swimmer plot showing the duration of continuous EEG monitoring (line length along x-axis) and state (entry = green; EEG risk = yellow; electrographic seizures [ES] = red) for each participant (y-axis). Middle row: proportion of participants in each state (entry, ES risk, ES) over time. Some participants remain in the same state over time (same color); some participants develop EEG risk factors but never experience ES (green to yellow transition); some participants experience ES without having experienced EEG risk factors (green to red transition); and some participants experience EEG risk factors and then ES (green to yellow to red transitions). Bottom row: remaining risk of transitioning to the ES state for patients in the entry (green) and EEG risk (yellow) states. Shaded areas represent the 95% confidence intervals. For the full cohort and each of the 4 clinical risk states, the risk of transitioning to the ES state remains higher over time for participants with EEG risk factors than those in the entry state.

