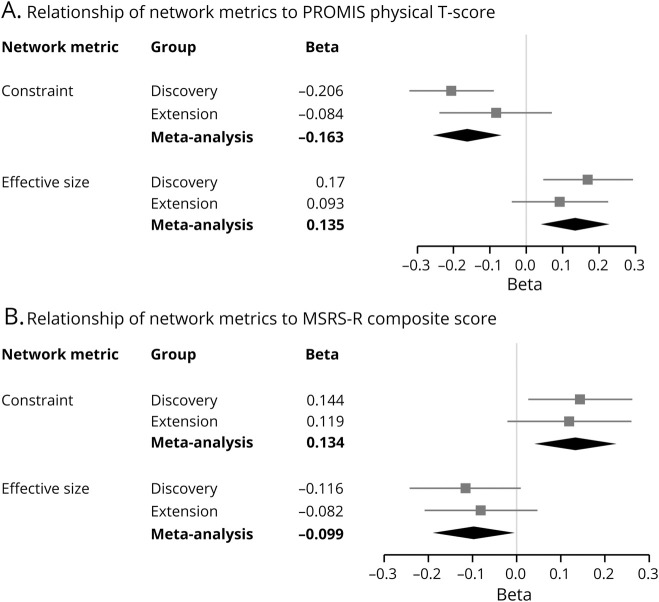
Figure 3. Forest plots of personal social network metrics and their relationship to neurologic outcomes.
For each cohort, the standardized beta coefficients from linear regressions of network metrics were plotted for Patient-Reported Outcomes Measurement Information System (PROMIS) (A) and Multiple Sclerosis Rating Scale–Revised (MSRS-R) (B). Higher scores on PROMIS indicate better physical function, whereas higher scores on MSRS-R indicate greater disability. Each square is the β coefficient, and each line is the 95% confidence interval (CI) of a network metric after adjustment for covariates. The diamond represents the summary β coefficient and 95% CI after a fixed-effects meta-analysis of the 2 cohorts. Constraint was inversely associated with PROMIS and directly associated with MSRS-R in the meta-analyses.

