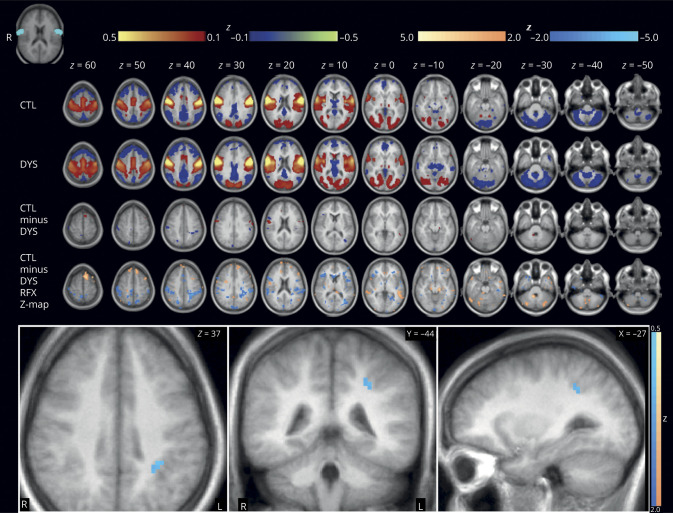
Figure 2. Bilateral sensorimotor tongue functional connectivity (FC) in focal dystonia (FD) and controls.
Group average and subtraction (controls − FD) correlation maps are depicted for the seed defined in the bilateral tongue representations in S1 and M1. Group average and subtraction color maps are thresholded at |z| ≥ 0.1 for control (CTL), dystonia (DYS), and CTL – DYS. Random effects analyses (voxel-wise t map) were done at the group level and t images were converted to equally probable Z-score images (random effects Z map), shown with color maps thresholded at |Z| ≥ 2.0. Cluster analysis revealed a cluster of significantly decreased negative FC in the left intraparietal sulcus, depicted in the axial, coronal, and sagittal planes (bottom) at a significance threshold of t ≥ 3.9 with a minimum cluster extent of 10 voxels. Warm colors represent positive and cool colors represent negative correlations. The seed is depicted in the top left corner. Images are oriented in radiologic convention.

