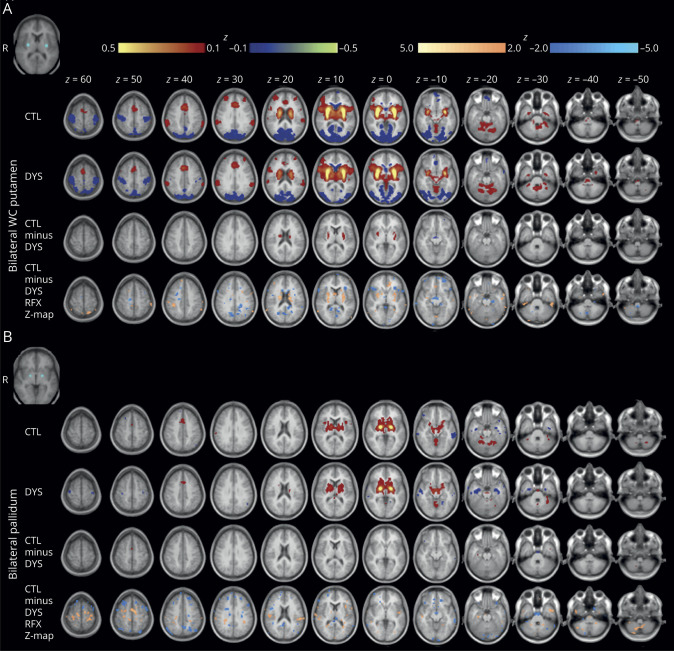
Figure 3. Putamen functional connectivity (FC) in focal dystonia (FD) and controls.
Group average and subtraction (control − FD) correlation maps are depicted for the seeds defined in (A). (A) Bilateral putamen at the area of peak difference in D1-like receptor binding in writer's cramp vs controls and (B) bilateral pallidum. Color maps are thresholded at |z| ≥ 0.1 for control (CTL), dystonia (DYS), and CTL – DYS. Random effects analyses (voxel-wise t map) were done at the group level and t images were converted to equally probable Z-score images (bottom row). Random effects color maps are thresholded at |Z| ≥ 2.0. Warm colors represent positive and cool colors represent negative correlations. The seed is depicted in the top left corner. Images are oriented in radiologic convention.

