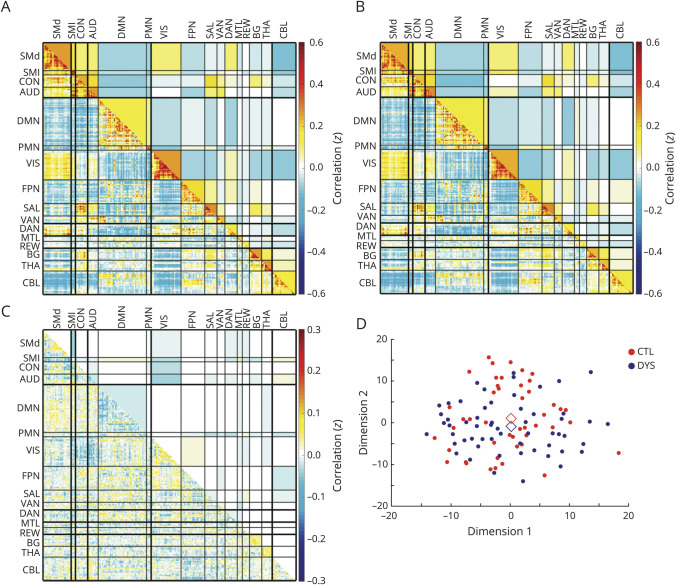
Figure 4. Preserved whole-brain correlation matrices in focal dystonia (FD).
Central weighted connectome object (g*) for (A) control and (B) FD groups, and (C) subtraction (control g* – FD g*). Upper triangles show composite block FC scores (average cross-correlation between regions of interest); the lower triangles show the matrix objects with all edges preserved. There is no difference between control and FD whole-brain correlation matrices structure (p = 0.23). (D) Multidimensional scaling shows clustering of FD subgroups and control whole-brain correlation matrices represented in 2D space. Diamonds indicate the central object for each group. AUD = auditory; BG = basal ganglia; CBL = cerebellum; CON = controls; DAN = dorsal attention network; DMN = default mode network; DYS = dystonia; FPN = fronto-pariatal network; MTL = medial temporal lobe; PMN = parietal memory network; REW = reward network; SAL = salience network; SMd = somatomotor dorsal; SMl = somatomotor lateral; THA = thalamus; VS = visual; VAN = ventral attention network.

