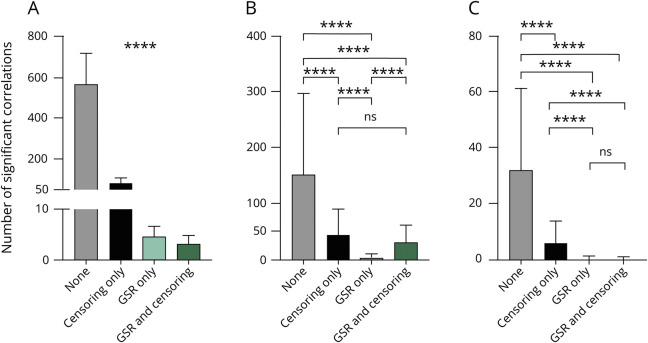
Figure 5. Global signal regression (GSR) and frame censoring reduce motion-related correlations.
Bar graphs show the number of significantly different correlations within the 300 × 300 region of interest whole-brain correlation matrix for (A) control (CTL) high vs CTL low mover participants, (B) focal dystonia (FD) high mover vs low mover participants, and (C) CTL vs FD motion-matched groups. GSR and frame censoring substantially reduce the number of spurious correlations arising from motion in all 3 comparisons. ****p < 0.0001.

