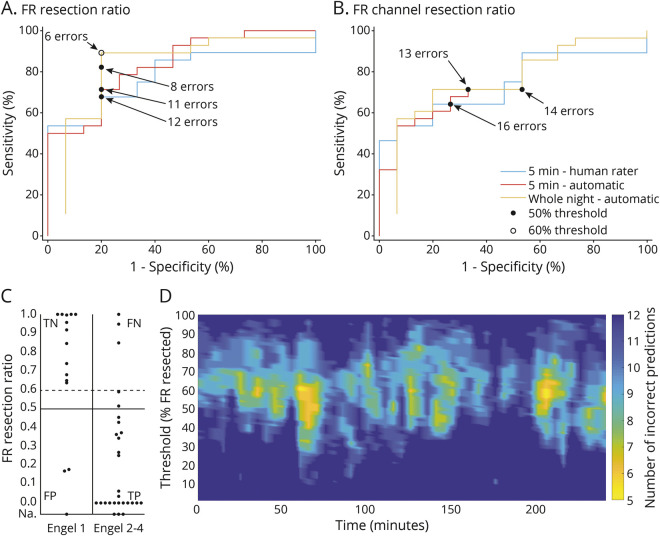
Figure 3. Association of FR or FR channel resection ratios with outcome.
(A and B) Receiver operating characteristic curves of different (A) fast ripple (FR) and (B) FR channel resection ratios in relation to outcome. Black dots correspond to the predefined 0.5 resection ratio threshold; white circle shows the point of best prediction accuracy of whole-night data, which corresponds to a 0.6 FR resection ratio threshold. (C) FR resection ratios calculated from the whole-night analysis in each patient with good vs poor outcome. Horizontal lines show the predefined 0.5 (solid line) and the optimal 0.6 (dashed line) resection ratio thresholds. Patients with no channels showing an FR rate ≥0.2/min are displayed according to their outcome on the line marked not available (Na). (D) Outcome prediction accuracy by automatic analysis at consecutive 5-minute segments. The x-axis shows the time from sleep start; the y-axis depicts the FR resection ratio threshold; and colors show the number of incorrect predictions of 43 patients at each time point and resection ratio. Overall, outcome prediction depends on the selection of the 5-minute episode during the overnight recording. Number of incorrect predictions tends to be lowest at an ≈0.6 FR resection ratio. Lowest number of incorrect predictions at any single 5-minute segment is 5 (accuracy 88%). However, number of incorrect predictions of most segments remains above that of the optimal whole-night analysis (i.e., >6 incorrect predictions). Patients who had no channels with an FR rate ≥0.2/min are included in all figures as true positive (TP; if the outcome was poor) or false positive (FP; if the outcome was good). FN = false negative; TN = true negative.

