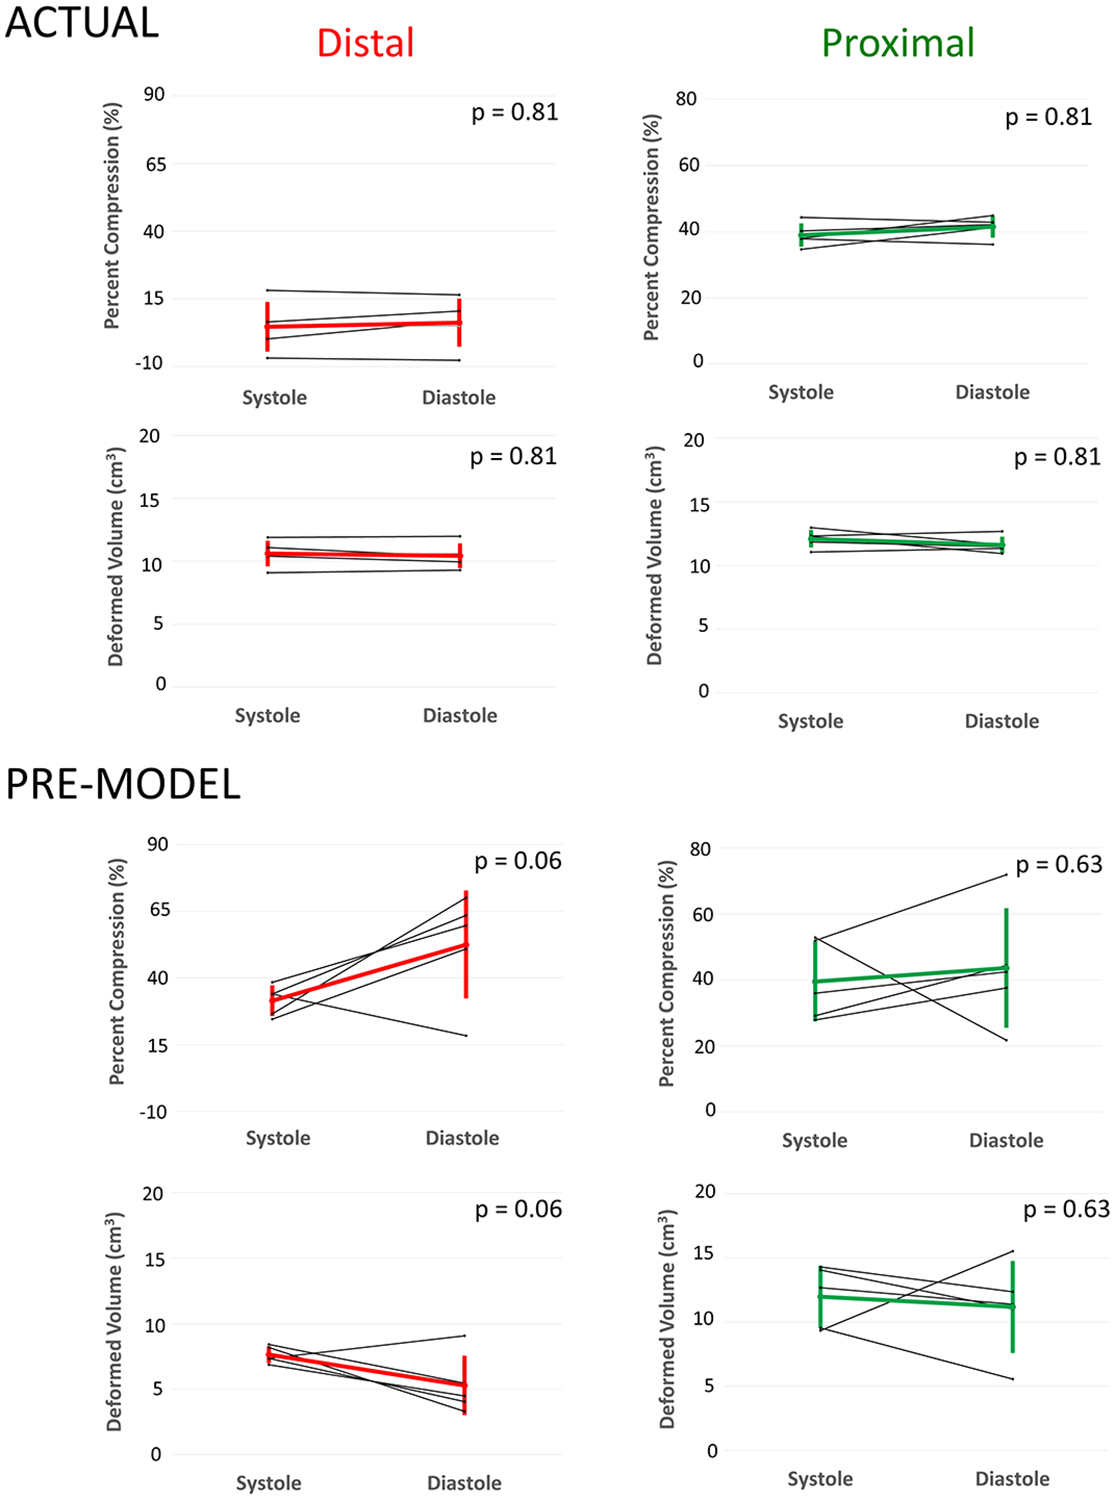
Figure 5. Comparison of Pre-Modeling vs. Actual Implant in Systole and Diastole.

Computer models shown with olor scale on representing amount of compression: Blue, no compression through red significant compression. White is the volume rendered actual device implant overlayed on device segmentation with underlying model used for quantification of volumes and compression.
