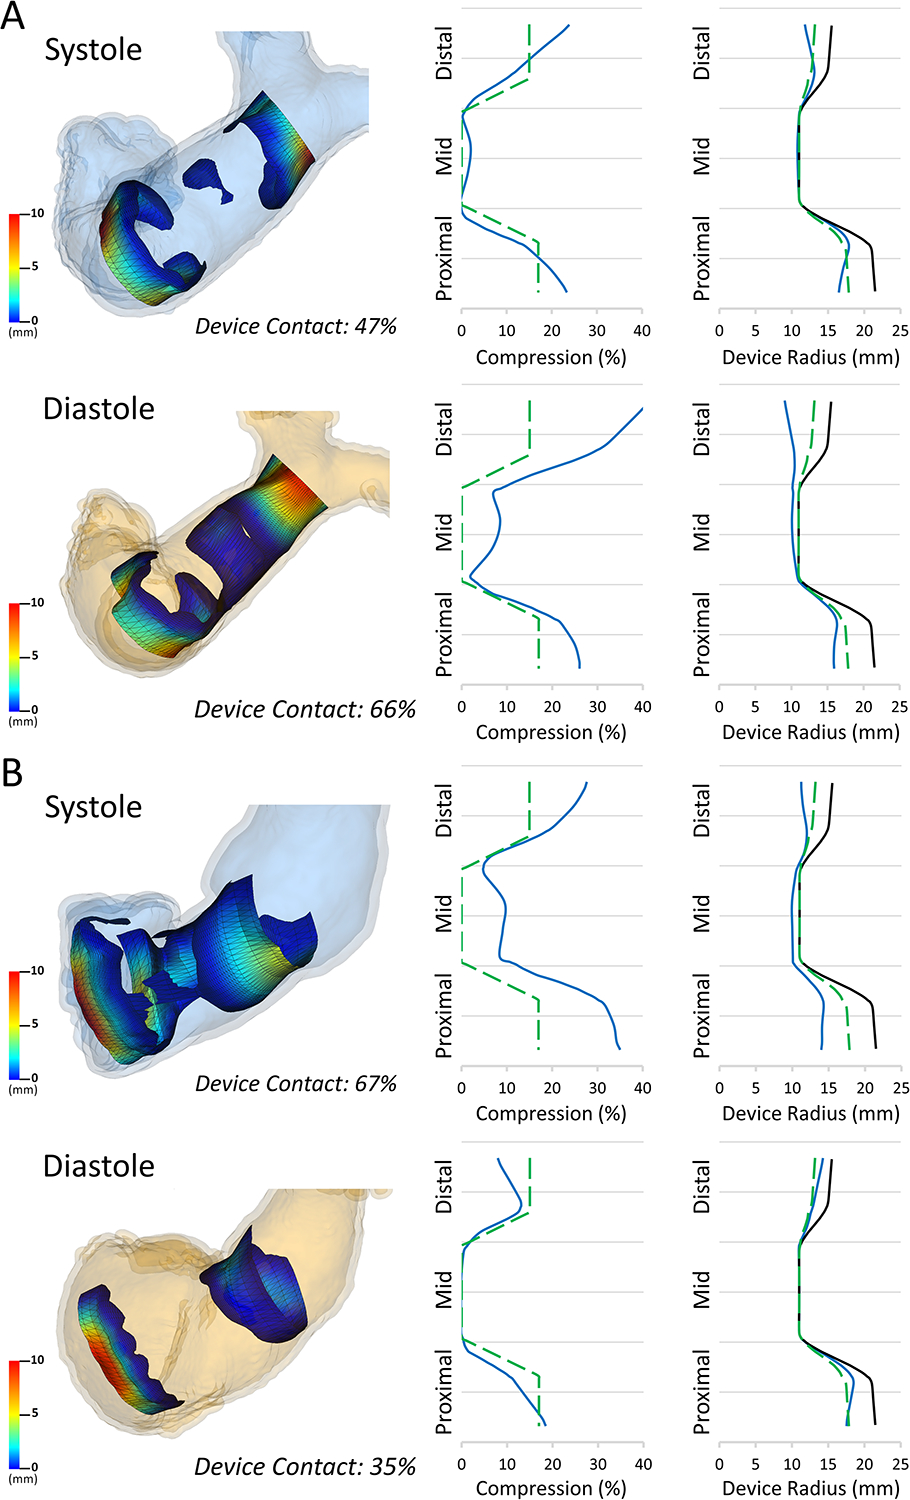
Figure 8. Estimated Contact Visualization and Graphical Summary Data in Pre-Implant Model.

Left: Estimated contact maps for A)Device Primarily in the Pulmonary Artery(Sheep 5) and B)Device Primarily in the Right Ventricle(Sheep 4) in both Systole and Diastole. Middle: Example plot of the mean % compression (blue) relative to ideal minimal compression (dashed green) across device length for each model; Right: Example plot of mean device radius (blue) compared to ideal minimal compression (dashed green) and fully expanded device (black) for each model.
