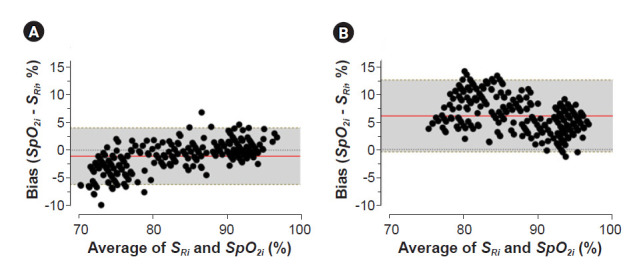
Fig. 3.

Bland-Altman plots, with mean bias and 95% limits of agreement. (A) WA-100 reusable finger probe, (B) CJ340NA disposable finger probe. Mean error and y = 0 are shown as red solid and black dashed lines, respectively. The upper limit (mean bias + 1.96 × SD) and lower limit (mean bias 1.96 × SD) of the agreement are shown as a gold dotted line. SpO2i: peripheral oxygen saturation measured by the device being tested, SRi: oxygen saturation of arterial blood measured by the reference CO-oximeter.
