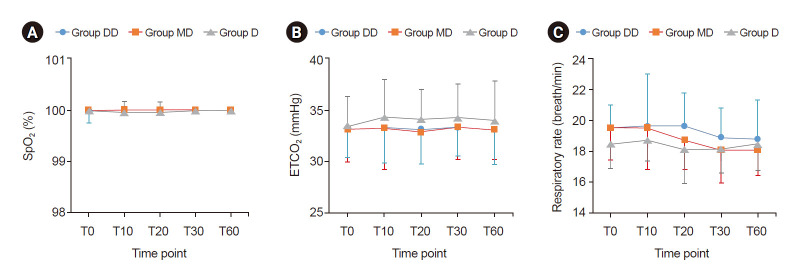
Fig. 4.
Trends of oxygen saturation (SpO2) (A), end-tidal carbon dioxide (ETCO2) (B), and respiratory rate (C). Graphs’ values are presented as mean ± SD. Group DD: initial dose of 0.5 μg/kg dexmedetomidine + continuous infusion of 0.5 μg/kg/h dexmedetomidine. Group MD: initial dose of 0.02 mg/kg midazolam + continuous infusion of 0.5 μg/kg/h dexmedetomidine. Group D: continuous infusion of 0.5 μg/kg/h dexmedetomidine without initial dose. T0: start sedation, T10, 20, 30, 60: 10, 20, 30, and 60 min after sedation. There were no significant differences among the groups at any time point.

