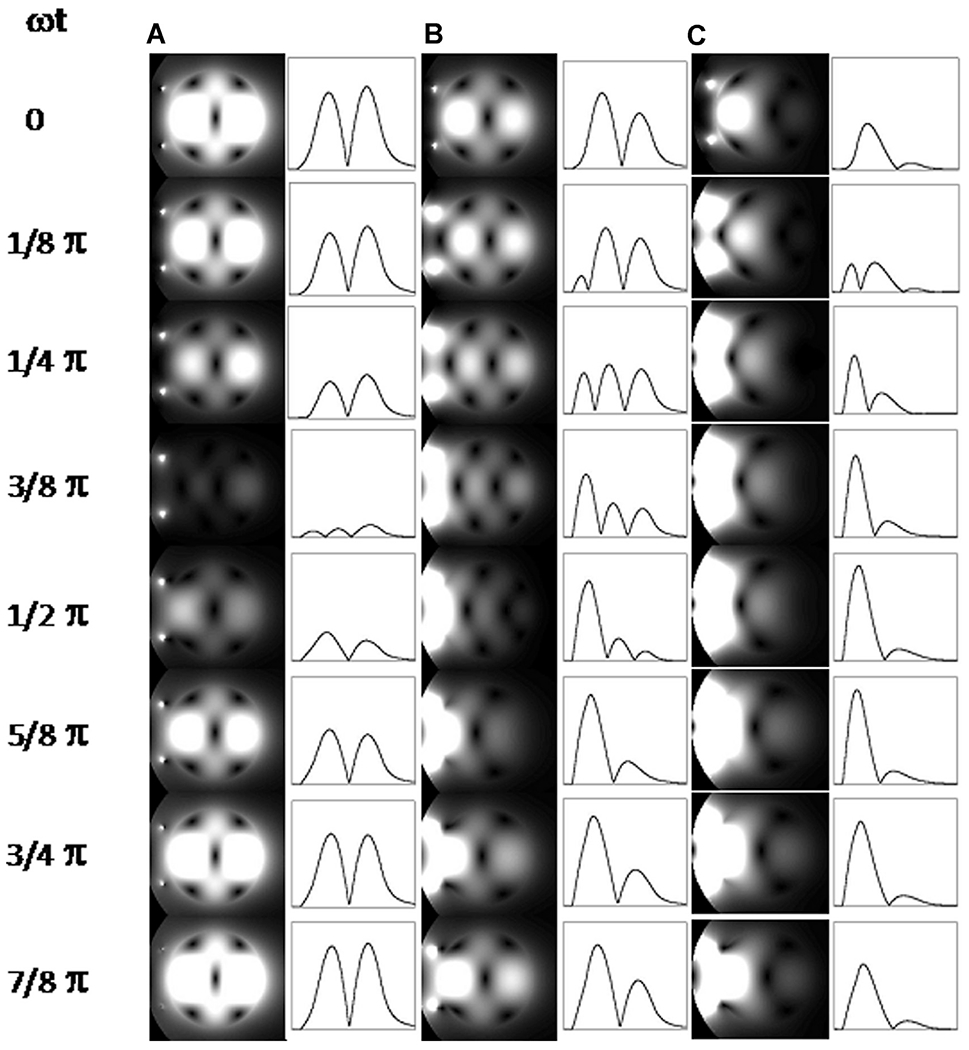
Fig. 1.

Two-dimensional (2D) plots of instantaneous transverse |B1| at progressing points during a half period in phantoms with (A) σ = 0 S/m, (B) σ = 0.26 S/m, and (C) σ = 0.67 S/m. The intensity profiles along the horizontal centerlines are also shown on the right of the 2D plots. The surface coil position is indicated by 2 small dots on the left side of the phantom. Because the temporal B1 strength varies greatly among these 3 cases, the signal intensities of temporal points are normalized individually for each conductivity condition in order to visualize the temporal change for all the conditions clearly.
