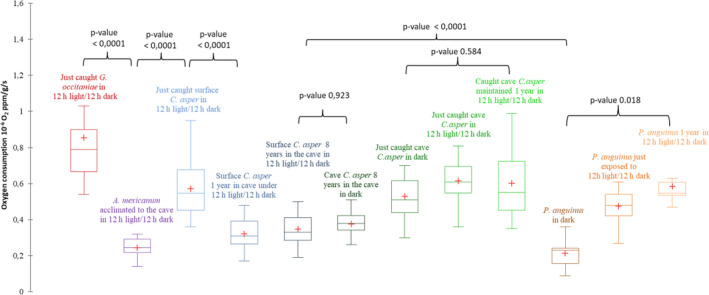
Figure 1.

Comparison of the oxygen consumption level in ppm per gram of body mass per second for Gobio occitaniae caught and tested in the cave under the 12 hr light/dark cycle (N = 20, red); reared Ambystoma mexicanum for several months in the Moulis cave under the 12 hr light/dark cycle (N = 20, violet); surface Calotriton asper just caught and exposed in the Moulis cave to the 12 hr light/dark cycle (N = 20, light blue); the same surface C. asper after one year under the 12 hr light/dark cycle in the cave (N = 20, medium blue); surface C. asper maintained for eight years in the cave under the 12 hr light/dark cycle (N = 20, dark blue); cave C. asper maintained for eight years in the cave in dark (N = 20, dark green); cave C. asper just caught and tested in the Moulis cave in dark (N = 20, olive green); the same cave C. asper after the 12 hr light/dark cycle (N = 20, lime green); the same cave C. asper after one year in the cave under the 12 hr light/dark cycle (N = 20, light green); P. anguinus reared in the Moulis cave for several years in dark (N = 20, dark orange); the same P. anguinus tested under the 12 hr light/dark cycle (N = 8, medium orange); and the same P. anguinus tested 1 year after the 12 hr light/dark (N = 8, light orange). The red crosses correspond to the means. The central horizontal bars are the medians. The lower and upper limits of the box are the first and third quartiles, respectively. The minimum is shown at the far bottom of the whisker, and the maximum at the far top
