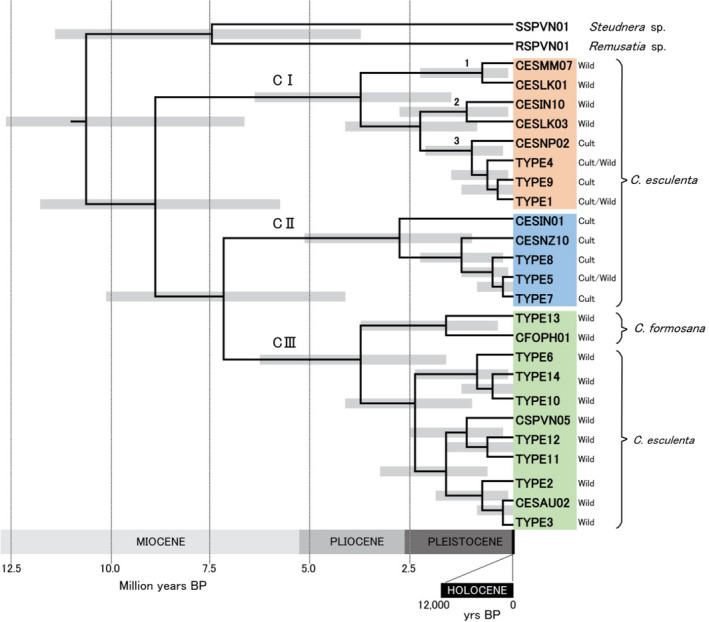
FIGURE 3.

Approximate divergence times for chloroplast clades and subclades in Colocasia esculenta and Colocasia formosana. The gray horizontal bar at each node indicates 95% highest posterior distribution (HPD) probability range. Clade color code: orange = CI, blue = CII, green = CIII. Subclades 1–3 are discussed in the text. Sample habitats (wild or cultivated) associated with each clade and subclade are shown at right (see notes on habitats in Table S1). All Clade III samples were wild (n = 39, Figure 4). Terminal labels refer to unique haplotypes (identified by sample codes given in Table S1), or types (1–14) found in multiple samples (Tables S1 and S3)
