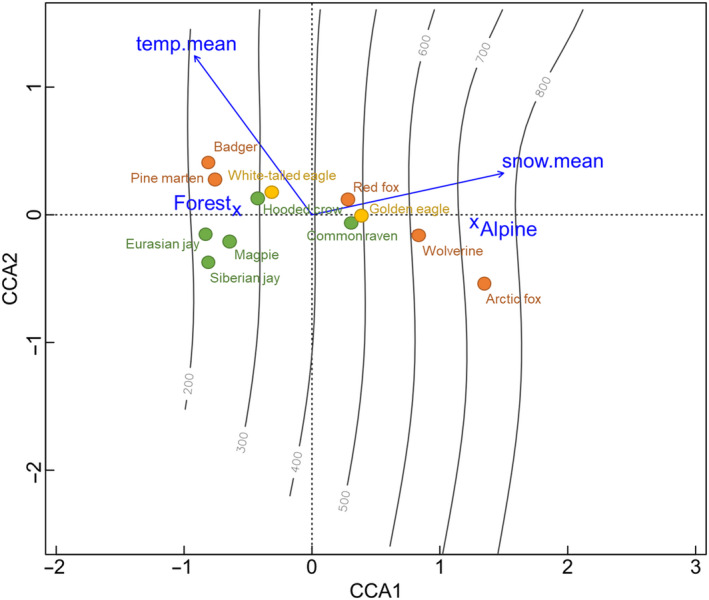
FIGURE 2.

Results from a canonical correspondence analysis (CCA) showing habitat preference of the species structured along environmental gradients, additionally illustrated by altitudinal isoclines (100‐m intervals). Blue arrows, crosses, and text represents the environmental gradients, where arrows show the direction of continuous environmental variables (temperature and snow depth). Species distribution within the environmental space is illustrated by colored circles, where green circles = corvids, yellow = raptors, and red = mammals
