
FIGURE 5.
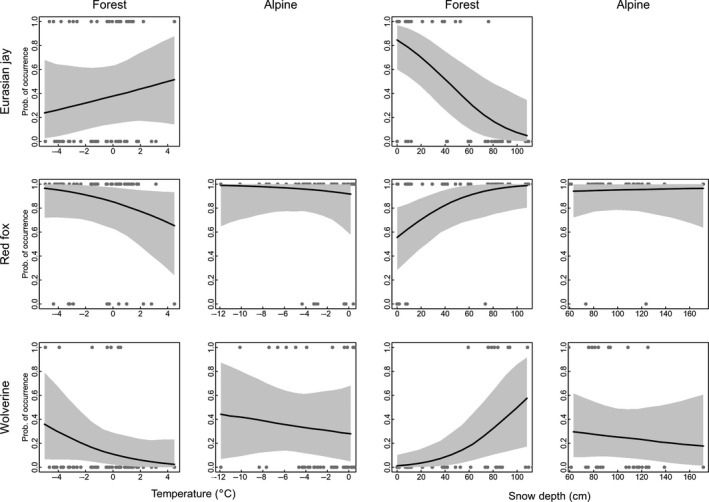
The probability of occurrence at baits in response to temperature and snow depth for selected species associated with either forest (Eurasian jay) or alpine tundra (wolverine), or habitat generalists (red fox). Solid lines are the predicted posterior probability of occurrence at baits from the species community model, whereas shaded gray areas represent 95% credible intervals. Gray points represent the bait sessions. Snow depth and temperature were constrained to their minimum/maximum values within each habitat type