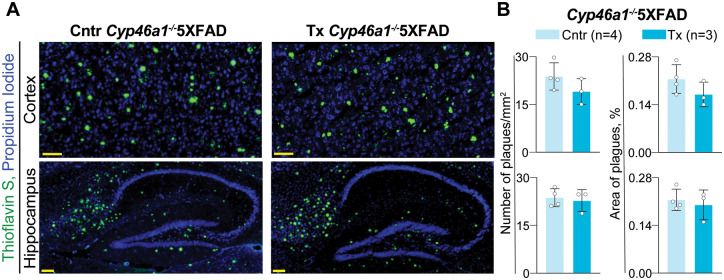
Figure 4.
EFV effects on the number and area of the Thioflavin S-positive plaques. (A) Representative images of the stained brain sections from control (Cntr, 2 male and 2 female mice) and EFV-treated (Tx, 1 female and 2 male mice) groups; nuclei were stained with propidium iodide and falsely coloured in blue. (B) Quantifications of the Thioflavin S-positive plaques. Area of plaques is expressed as a percentage from the total area of either cortex or hippocampus. Statistical analysis: an unpaired, two-tailed Student’s test. No significant differences were found between Cntr and EFV-treated Tx groups. Scale bars, 100 µM.

