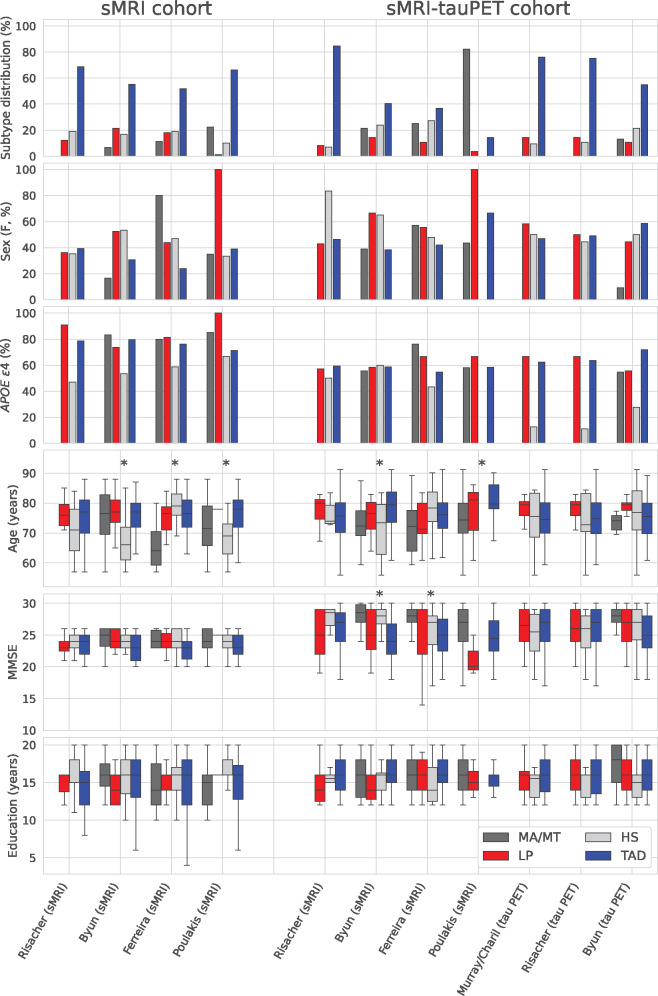
Figure 2.
Demographic and clinical characteristics captured by the different subtyping methods. The bar plots for sex and APOE ε4 show what percentage of patients in each subtype were females and APOE ε4 carriers, respectively. Kruskal–Wallis hypothesis testing was conducted comparing the subtypes within each method; *P < 0.05 within the subtyping method. APOE = apolipoprotein; F = female; HS = hippocampal-sparing; LP = limbic-predominant; MA = minimal atrophy; MMSE = mini mental state exam; MT = minimal tau; PET = positron emission tomography; sMRI = structural magnetic resonance imaging; TAD = typical AD.

