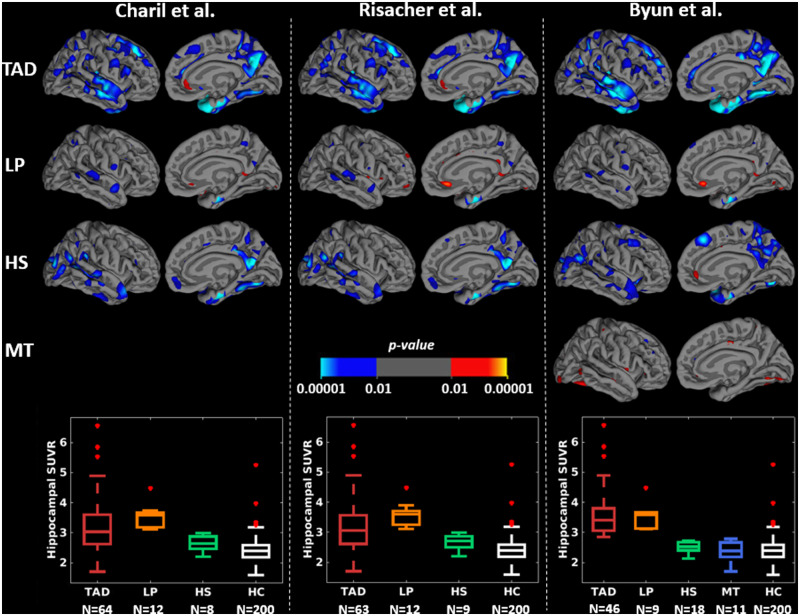
Figure 4.
Group-level PVC tau PET uptake maps across subtyping methods using the hippocampus in the sMRI-tauPET cohort. For simplicity, only left lateral and medial views are presented since very similar results were obtained for the right lateral and medial views. Differences in tau PET uptake maps are shown in each subtype relative to HC, generated by fitting general linear model at each vertex. Cyan regions reflect greater PVC tau PET uptake in Alzheimer’s disease subtypes relative to HC. All brain maps are uncorrected for multiple comparisons at P < 0.01. HC = healthy control; HS = hippocampal-sparing; LP = limbic-predominant; MT = minimal tau; TAD = typical AD.

