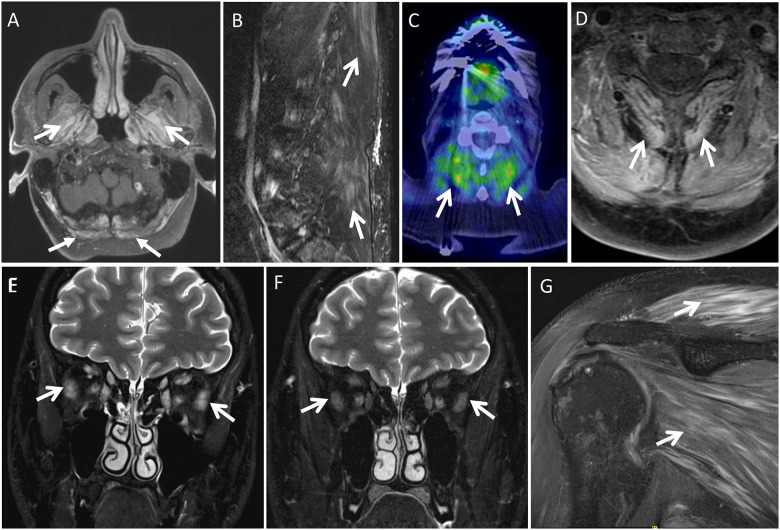
Figure 3.
Imaging in ICIAM. Imaging findings of myopathy in five different patients (A–G). (A) Contrast-enhanced axial fat-suppressed T1-weighted brain MRI at the level of foramen magnum reveals contrast enhancement in the muscles of mastication (arrows) and superior posterior neck muscles (block arrows). (B) Off-midline sagittal fat-suppressed T2-weighted lumbar spine MRI demonstrates mild streaky T2-hyperintensity of the lumbar and visualized lower thoracic posterior paraspinal musculature (arrows). (C) Axial 18F-FDG PET CT fused image at C4–5 shows increased FDG uptake in the posterior paraspinal neck musculature (arrows). (D) In the same patient as C, correlative contrast-enhanced axial fat-suppressed T1-weighted cervical spine MRI demonstrates mildly increased enhancement of this posterior paraspinal neck musculature (arrows). (E,F) Coronal fat-suppressed T2-weighted orbit MRI on initial (E) and follow-up (F) initially shows T2 hyperintensity and mild enlargement of the extraocular muscles bilaterally, which resolves on follow-up (arrows on lateral recti). (G) Oblique coronal T2-weighted fat-suppressed shoulder MRI reveals feather like oedema-type T2-hyperintensity enhancement of the shoulder girdle muscles (arrows).

