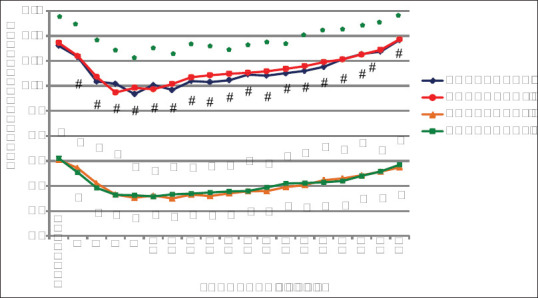
Figure 2.

Mean systolic blood pressure (SBP) mmHg and diastolic blood pressure (DBP) mmHg.* Denotes P value > 0.05 of SBP between Group-N and Group-M. # denotes P value < 0.001 for SBP of Group-N and Group-M when compared with the value of the first episode of hypotension.^ denotes P value > 0.05 of DBP between Group-N and Group-M. $ denotes P value < 0.001 for DBP of Group-N and Group-M when compared with the value of the first episode of hypotension
