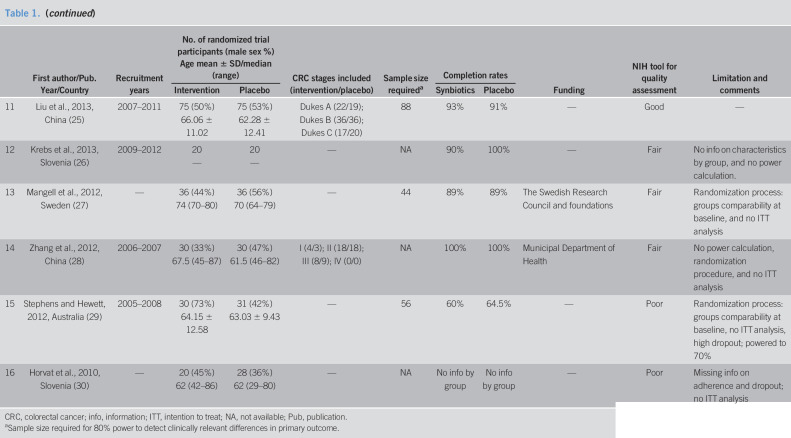
Table 1.
Characteristics of studies included in systematic review
| First author/Pub. Year/Country | Recruitment years | No. of randomized trial participants (male sex %) Age mean ± SD/median (range) |
CRC stages included (intervention/placebo) | Sample size requireda | Completion rates | Funding | NIH tool for quality assessment | Limitation and comments | |||
| Intervention | Placebo | Synbiotics | Placebo | ||||||||
| 1 | Polakowski et al., 2019, Brazil (15) | — | 36 (55%) 60.9 ± 6.7 |
37 (51%) 58.9 ± 6.3 |
I (8/9); II (22/21); III (6/7) | 77 | — | — | — | Fair | No ITT analysis |
| 2 | Golkhalkhali et al., 2018, Malaysia (16) | — | 70 No info |
70 No info |
— | 128 | — | — | University of Malaysia | Fair | No info on sex, intervention included, and omega 3; no ITT analysis |
| 3 | Flesch et al., 2017, Brazil (17) | 2013–2015 | 49 (45%) 64.5 |
42 (37%) 61.1 |
I (14/11); II (20/20); III (14/6); IV (1/5) | 90 | — | — | None | Fair | No ITT analysis |
| 4 | Theodoropoulos et al., 2016, Greece (18) | 2008–2012 | 37 (53%) 66.8 ± 2.2 |
36 (62%) 69 ± 1.4 |
0 (5/8); I (9, 9); II (15/10); III (9/10); IV (0/1) | 66 | 89% | 92% | — | Fair | No ITT analysis |
| 5 | Yang et al., 2016, China (19) | 2011–2012 | 30 (50%) 63.9 ± 12.25 |
30 (40%) 62.2 ± 11.1 |
0–II (23/21); III (7/9) | NA | 71% | 81% | National Natural Science Foundation | Poor | No ITT analysis, no power calculation, and high dropout rate |
| 6 | Tan et al., 2016, Malaysia (20) | — | 20 (55%) 64.3 ± 14.5 |
20 (65%) 68.4 ± 11.9 | I (7/4); II (7/11); III (6/5); IV (0/0) | NA | 100% | 100% | B-Crobes Laboratory Sdn. Bhd. | Fair | No power calculation. Industry funded |
| 7 | Kotzampassi et al., 2015, Greece (21) | 2013–2014 | 84 (68%) 65.9 ± 11.5 |
80 (72%) 66.4 ± 11.9 | — | 416 | 98% | 98% | — | Fair | Study prematurely stopped after 40% enrolment due to efficacy in the primary outcome, and no ITT analysis |
| 8 | Mego et al., 2015, Slovakia (22) | 2011–2013 | 23 (61%) 62 (45–75) |
23 (52%) 64 (42–81) |
Metastatic (stage IV) | 200 | 100% | 100% | Ministry of Education | Fair | Group comparability at baseline; study was prematurely terminated due to slow accrual |
| 9 | Liu et al., 2015, China (23) | 2007–2013 | 66 (53%) 65.6 ± 18.2 |
68 (51%) 60.2 ± 16.2 | Colorectal liver metastases (stage IV) | 240 | 89% | 85% | National Natural Science Foundation | Fair | Study population too small for significant results |
| 10 | Lee et al., 2014, South Korea (24) | 2012–2012 | 33 (54%) 56.36 ± 6.02 | 33 (62%) 56.03 ± 10.86 | II (11/17); III (16/13) | 50 (1-sided α = 10%) | 85% | 97% | Ministry of Science | Poor | Study population too small for significant results, and no ITT analysis |
| 11 | Liu et al., 2013, China (25) | 2007–2011 | 75 (50%) 66.06 ± 11.02 | 75 (53%) 62.28 ± 12.41 | Dukes A (22/19); Dukes B (36/36); Dukes C (17/20) | 88 | 93% | 91% | — | Good | — |
| 12 | Krebs et al., 2013, Slovenia (26) | 2009–2012 | 20 — |
20 — |
— | NA | 90% | 100% | — | Fair | No info on characteristics by group, and no power calculation. |
| 13 | Mangell et al., 2012, Sweden (27) | — | 36 (44%) 74 (70–80) |
36 (56%) 70 (64–79) |
— | 44 | 89% | 89% | The Swedish Research Council and foundations | Fair | Randomization process: groups comparability at baseline, and no ITT analysis |
| 14 | Zhang et al., 2012, China (28) | 2006–2007 | 30 (33%) 67.5 (45–87) |
30 (47%) 61.5 (46–82) |
I (4/3); II (18/18); III (8/9); IV (0/0) | NA | 100% | 100% | Municipal Department of Health | Fair | No power calculation, randomization procedure, and no ITT analysis |
| 15 | Stephens and Hewett, 2012, Australia (29) | 2005–2008 | 30 (73%) 64.15 ± 12.58 |
31 (42%) 63.03 ± 9.43 |
— | 56 | 60% | 64.5% | — | Poor | Randomization process: groups comparability at baseline, no ITT analysis, high dropout; powered to 70% |
| 16 | Horvat et al., 2010, Slovenia (30) | — | 20 (45%) 62 (42–86) |
28 (36%) 62 (29–80) |
— | NA | No info by group | No info by group | — | Poor | Missing info on adherence and dropout; no ITT analysis |
CRC, colorectal cancer; info, information; ITT, intention to treat; NA, not available; Pub, publication.
Sample size required for 80% power to detect clinically relevant differences in primary outcome.

