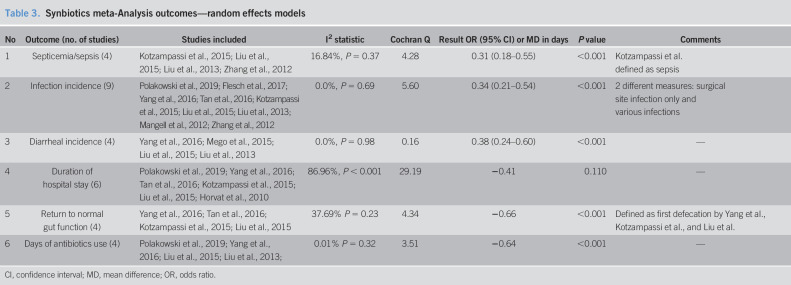
Table 3.
Synbiotics meta-Analysis outcomes—random effects models
| No | Outcome (no. of studies) | Studies included | I2 statistic | Cochran Q | Result OR (95% CI) or MD in days | P value | Comments |
| 1 | Septicemia/sepsis (4) | Kotzampassi et al., 2015; Liu et al., 2015; Liu et al., 2013; Zhang et al., 2012 | 16.84%, P = 0.37 | 4.28 | 0.31 (0.18–0.55) | <0.001 | Kotzampassi et al. defined as sepsis |
| 2 | Infection incidence (9) | Polakowski et al., 2019; Flesch et al., 2017; Yang et al., 2016; Tan et al., 2016; Kotzampassi et al., 2015; Liu et al., 2015; Liu et al., 2013; Mangell et al., 2012; Zhang et al., 2012 | 0.0%, P = 0.69 | 5.60 | 0.34 (0.21–0.54) | <0.001 | 2 different measures: surgical site infection only and various infections |
| 3 | Diarrheal incidence (4) | Yang et al., 2016; Mego et al., 2015; Liu et al., 2015; Liu et al., 2013 | 0.0%, P = 0.98 | 0.16 | 0.38 (0.24–0.60) | <0.001 | — |
| 4 | Duration of hospital stay (6) | Polakowski et al., 2019; Yang et al., 2016; Tan et al., 2016; Kotzampassi et al., 2015; Liu et al., 2015; Horvat et al., 2010 | 86.96%, P < 0.001 | 29.19 | −0.41 | 0.110 | — |
| 5 | Return to normal gut function (4) | Yang et al., 2016; Tan et al., 2016; Kotzampassi et al., 2015; Liu et al., 2015 | 37.69% P = 0.23 | 4.34 | −0.66 | <0.001 | Defined as first defecation by Yang et al., Kotzampassi et al., and Liu et al. |
| 6 | Days of antibiotics use (4) | Polakowski et al., 2019; Yang et al., 2016; Liu et al., 2015; Liu et al., 2013; | 0.01% P = 0.32 | 3.51 | −0.64 | <0.001 | — |
CI, confidence interval; MD, mean difference; OR, odds ratio.

