
Fig. 8.
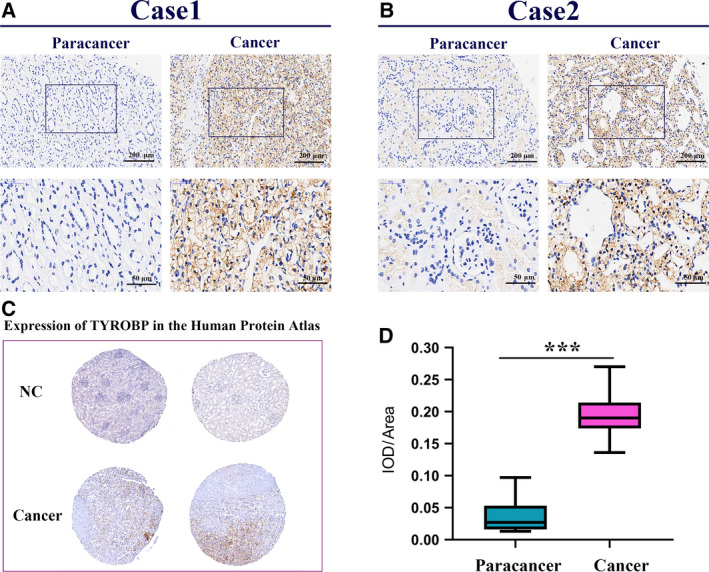
TYROBP is up‐regulated in ccRCC samples compared with renal tissues. We used the paired t‐test for statistical analysis, and P < 0.05 was considered statistically significant (we selected 10 samples for testing and repeated three times). (A) IHC analysis of TYROBP in ccRCC tissue and paracarcinoma (case 1); scale bars: 200 and 50 μm, respectively. (B) IHC analysis of TYROBP in ccRCC tissue and paracarcinoma (case 2); scale bars: 200 and 50 μm, respectively. (C) Immunohistochemical images of TYROBP in kidney cancer and normal tissues obtained from Human Protein Atlas. (D) Integrated optical density/area analysis was performed using imagepro plussoftware, and the statistics were performed by graphpad prism 8 software ( ***P < 0.001).