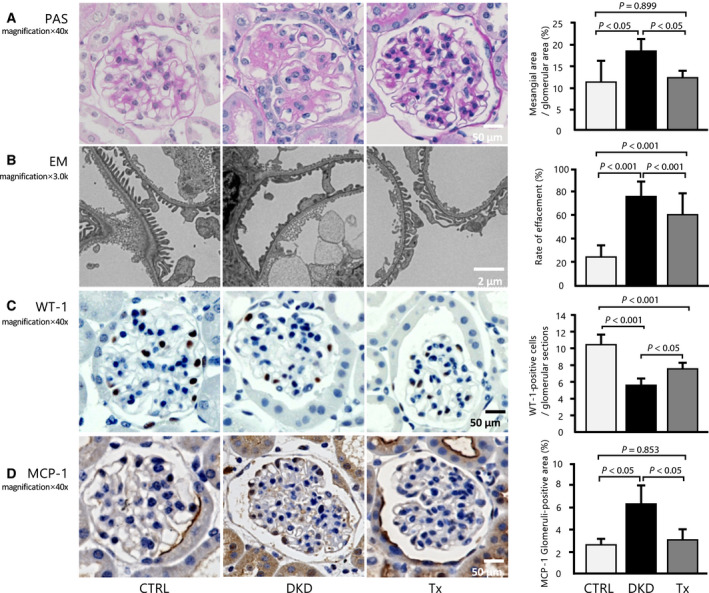
Fig. 1.

Effect of tofogliflozin on histologic improvement in the glomeruli. (A) Histologic analyses of the glomeruli after eight weeks of treatment, as shown in these representative images of the kidney mesangial matrix area (PAS) (40×, scale bar: 50 μm; n = 5 per group, 20 glomeruli per mouse). (B) Quantitative analysis of effacement rate (3000×, scale bar: 2 μm; n = 5 per group, five glomeruli and capillaries per mouse). (C) Representative micrographs show glomerular WT1 staining for each group (40×, scale bar: 50 μm; n = 5 per group, 20 glomeruli per mouse). (D) Inflammatory change in the glomeruli in MCP‐1 staining (40×, scale bar: 50 μm; n = 5 per group, at least 10 glomeruli per mouse). Data are presented as mean ± standard deviation. One‐way ANOVA was applied.
