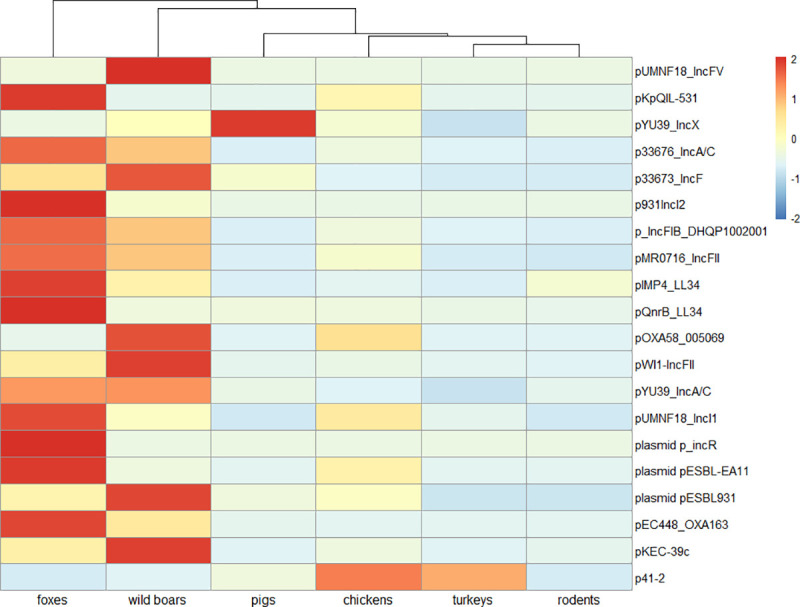
Fig 4. Plasmids possibly involved in resistance transfer.

Heat map based on plasmids relative abundances with Z-score scaling. Samples with high relative abundances get positive values (red color) and those with relatively low get negative values (blue colors). Complete-linkage clustering of Euclidian distances was applied for clustering the samples.
