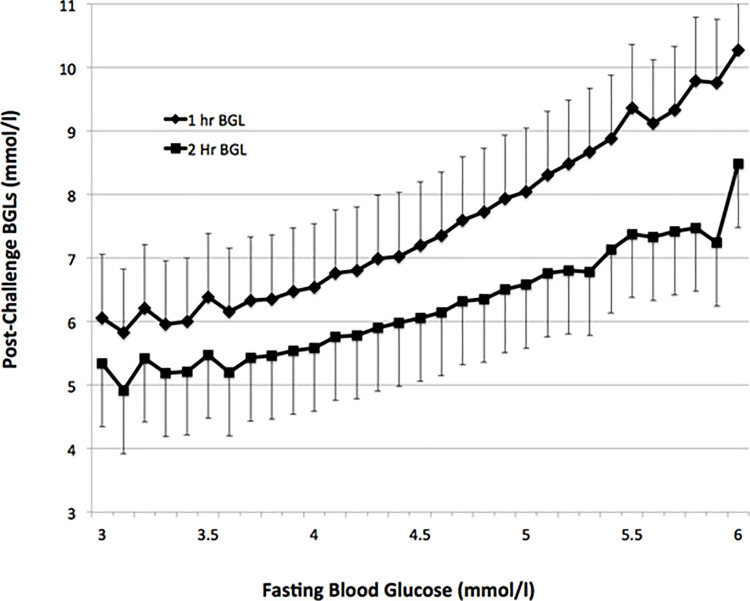
Fig 1. Relationship between FBG and post-load BGLs.
Shown are the post-challenge BGL values (mean; standard deviation) on an oral glucose tolerance test in 26,242 patients between January 1, 2015 and June 30, 2015 from the three major laboratories in Queensland, Australia for FBGs between 3.0 and 6.0mmol/l. Less than 0.1% of patients had FBG below or above these values.

