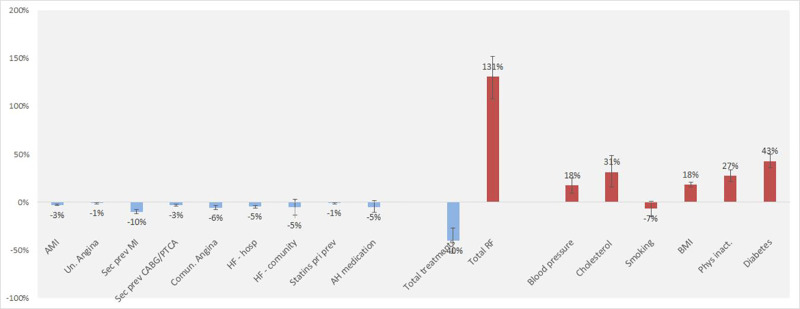
Fig 1. Proportion of all coronary heart disease deaths explained by the model, which were attributed to the contribution of treatments and risk factors in Mexico, 2000 to 2012.
The bars are the best model estimate and the vertical lines the extreme minimum and maximum estimates in sensitivity analysis. CABG indicates coronary artery bypass graft; PTCA Percutaneous transluminal coronary angioplasty; HF heart failure, AH antihypertensive and PCI percutaneous coronary intervention.

