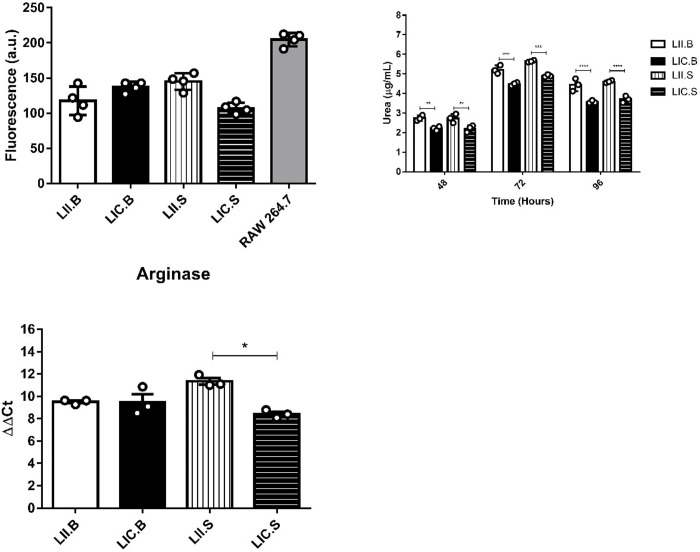
Fig 5. In vitro NOS and ARG activities.
(A) NOS activity of promastigotes. (B) ARG activity by urea production by promastigotes. (C) Relative expression of the arginase gene. The intracellular NO production was detected by DAF-2DA labeling. RAW 264.7 macrophages were used as the positive control. The urea production was measured by spectrometry at 540 nm. The relative expression of the arginase gene was evaluated by qRT-PCR. The alfa-tubulin gene was used as the reference gene. LIC.B (L. infantum chagasi isolated from BALB/c mice); LII.B (L. infantum infantum isolated from BALB/c mice); LIC.S (L. infantum chagasi isolated from Swiss Webster mice); and LII.S (L. infantum infantum isolated from Swiss Webster mice). *p ≤ 0.05; **p ≤ 0.009; ***p ≤ 0.0009; ****p < 0.0001. The values are represented by mean ± standard deviation of 3 independent experiments realized in experimental triplicate.

