
Fig 4. Distribution of functional consequence using VEP annotation tool and RegulomeDB scores for SNPs linked to neurological and growth phenotypes identified through two-way (mutual information) and three-way (Delta 3) dependency analysis.
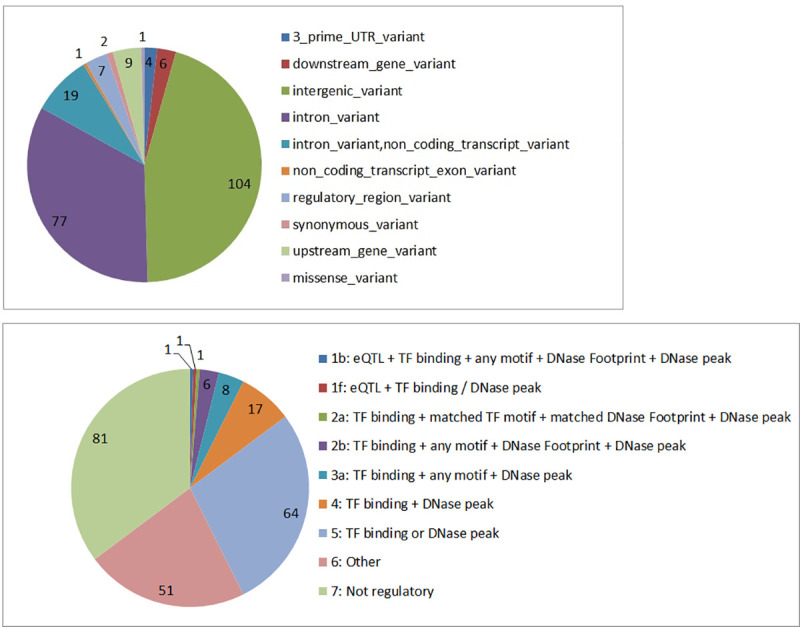
a) Distribution of candidate SNPs across the functional locations based on VEP annotation. Most of the SNPs are located in non-coding locations, i.e., intronic and intergenic regions of the genome. b) The RegulomeDB score for the candidate SNPs. The lower the score, the more likely it is that a SNP has a regulatory function. eQTL = expression Quantitative Trait Loci; TF = Transcription Factor.