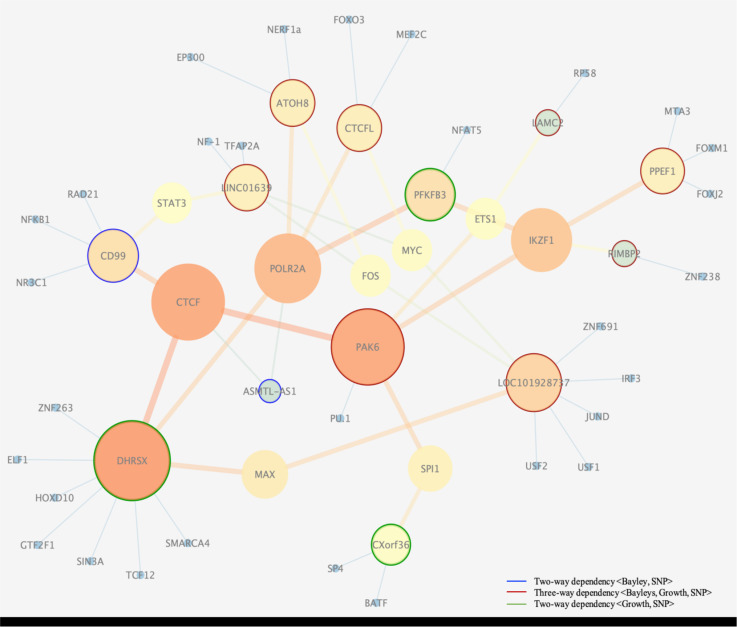
Fig 5. Regulatory interaction network.
Depicted are interactions of transcription factors connected with regulatory SNPs (noted by their nearest gene). Clustering and visualization of the network was carried out using Cytoscape v.3.3.0 (undirected network and betweenness centrality statistics). The degree of nodes (the number of edges per node) is shown with their color, ranging from orange (the highest degree), to yellow, green, and then blue (the lowest degree). In addition, larger nodes correspond to hubs with higher degree. The edges with high betweenness centrality, whose removal would partition the network into connected subnetworks, are depicted by thick, orange lines. The small blue nodes are additional factors connected to the dependent loci. “Orphan genes” (unconnected nodes) are not shown. Nodes with blue, green, and red rings correspond to loci detected with two-way and three-way analysis (see the legend).

