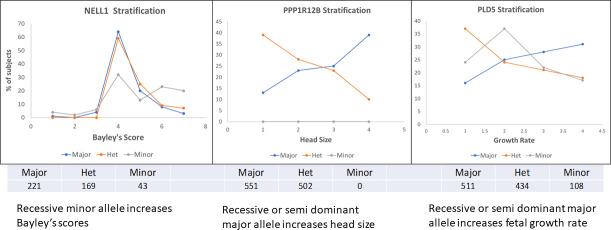
Fig 8. The distributions of phenotypes by genotype for three of the pairwise genetic variant effects.
The numbers of subjects with each genotype are shown under each panel. a. NELL1 shows a distribution that suggests a strong dominance of the major allele for the Bayley scale score distribution. b. PPP1R12B shows a diametrically opposite distribution between the homozygote and heterozygote. c. PLD5 shows the same as in b) but with a distinct homozygous minor distribution.

