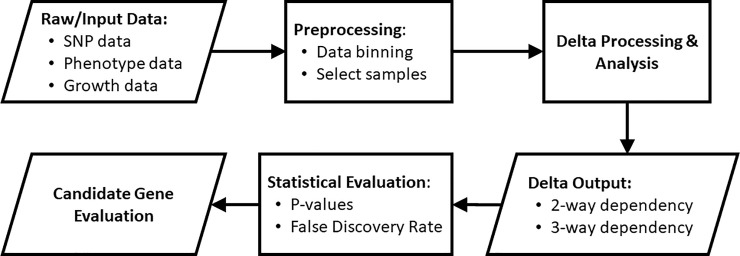
Fig 10. Flow chart of the process of selecting gene candidates using our dependency measures.
The measures of multi-variable dependencies and Delta are described in Section 4.1.3, and the preprocessing of phenotypes and SNP data are described in Section 4.2. The statistical evaluation is explained in Section 4.3.

