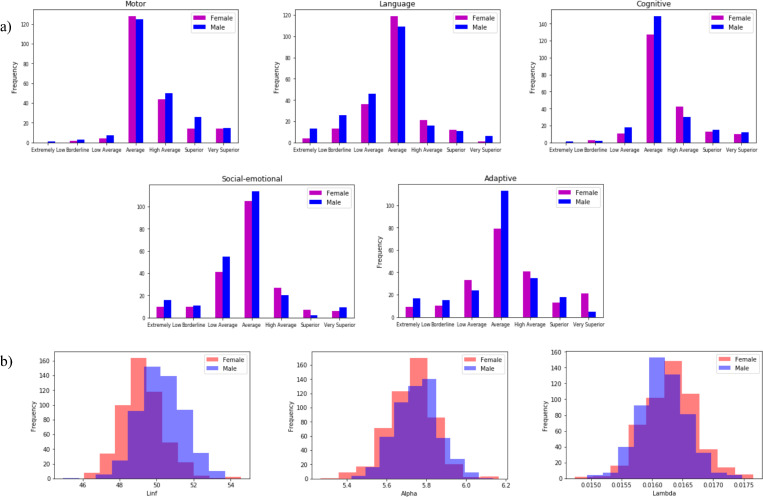
Fig 12. Distribution of SNPs in the X and Y region for Bayley’s and growth phenotypes.
a) The distributions of Bayley phenotypes by male and female infants used for the two-variable <Bayley, SNPs> analysis. b) The distributions of Growth phenotypes by male and female infants used for the two-variable <Growth, SNPs> analysis.

