
Fig 1. Change of thermal hyperalgesia in neuropathic pain model mice.
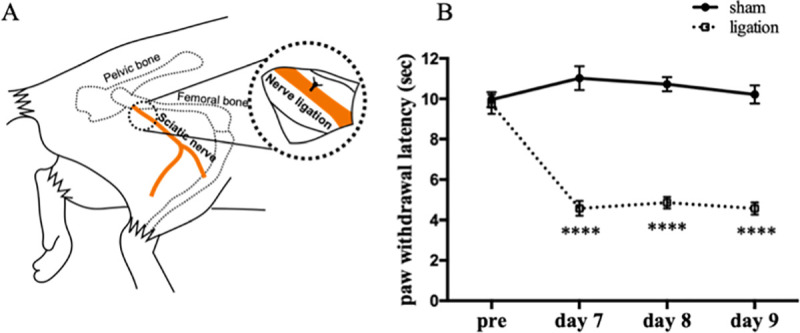
Schematic diagram of sciatic nerve ligation (A). Plantar tests were performed before nerve ligation surgery, 7, 8 and 9 days after surgery. Data are expressed as means ± SEM. Data are analyzed using two-way ANOVA followed by Bonferroni’s post hoc test and considered statistically significant at ****P < 0.0001 when comparing the sham (n = 8) and nerve ligation groups (n = 8) (B).