
Fig 4. Amitriptyline improved quality of sleep in neuropathic pain model.
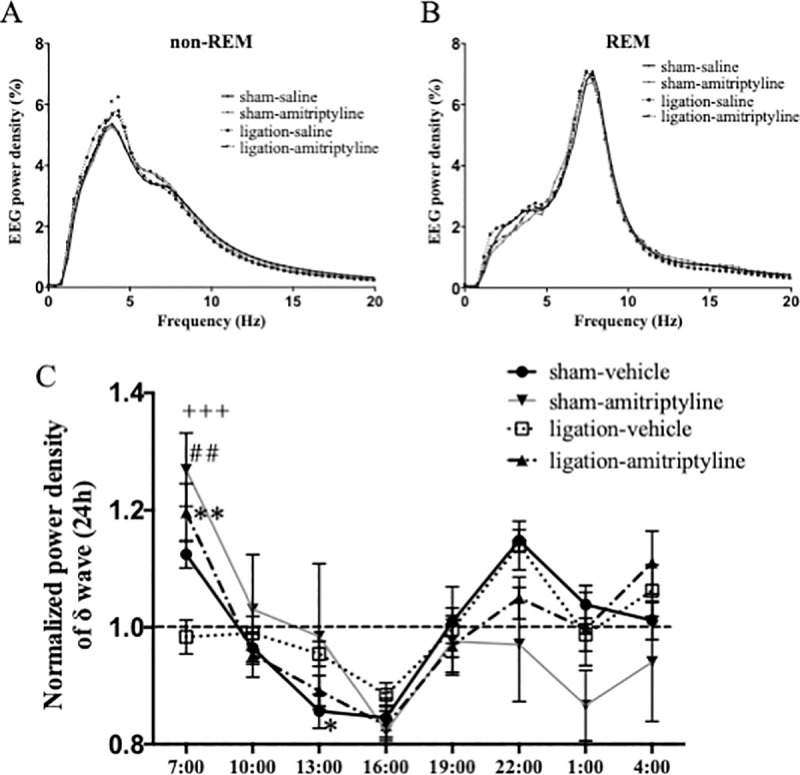
Distribution of EEG power density in each frequency during non-REM and REM sleep. Data are expressed as means only. *P < 0.05 at 4.2 Hz and 4.7 Hz when comparing sham-vehicle and ligation-vehicle groups (A). Time changes of the normalized power density of δ wave were plotted every 3 hours in sham (n = 5–7) and nerve ligation (n = 7) mice. Data are expressed as means ± SEM (B) and are analyzed using two-way ANOVA followed by Bonferroni’s post hoc test and considered statistically significant at **P < 0.01 when comparing sham-vehicle and ligation-vehicle groups, ##P < 0.01 when comparing ligation-vehicle and ligation amitriptyline group, and +++P < 0.001 when comparing the sham-amitriptyline and ligation-vehicle groups.