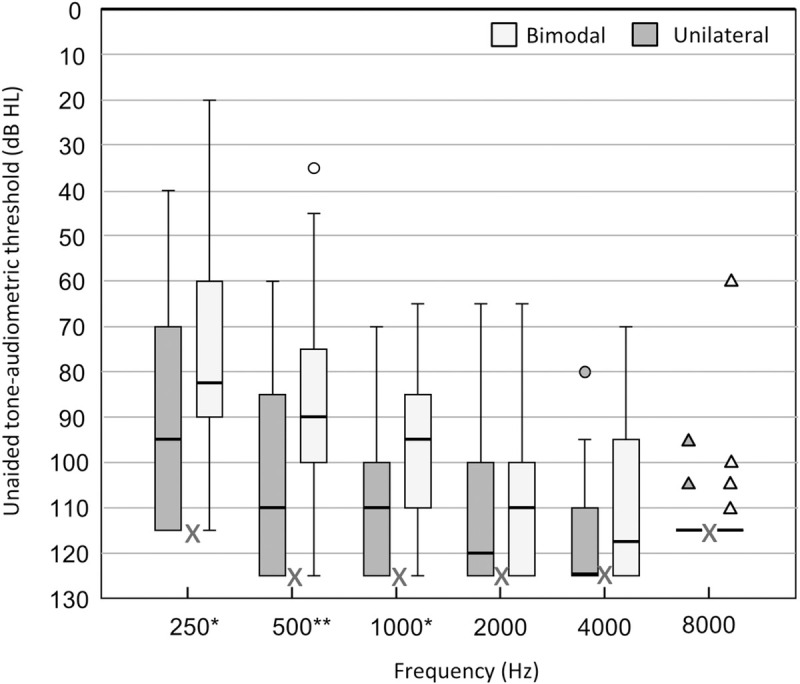
Fig 1. Residual Hearing at study involvement.

Unaided pure-tone thresholds in the non-implanted ear for bimodal (n = 26) and unilateral (n = 22) subjects within one year around the time of study involvement. If no response could be recorded within the limits of the audiometer, a value of 5dB HL greater than the maximum tested level was entered (see X markings). Box plots represent the distribution per frequency (median and interquartile range), with whiskers denoting minimum and maximum values within 1.5 times the interquartile range, circles denoting outliers and triangles denoting extremes. Significant differences between groups are based on independent-samples Student T-tests per frequency (*p<0.05, **p<0.01).
