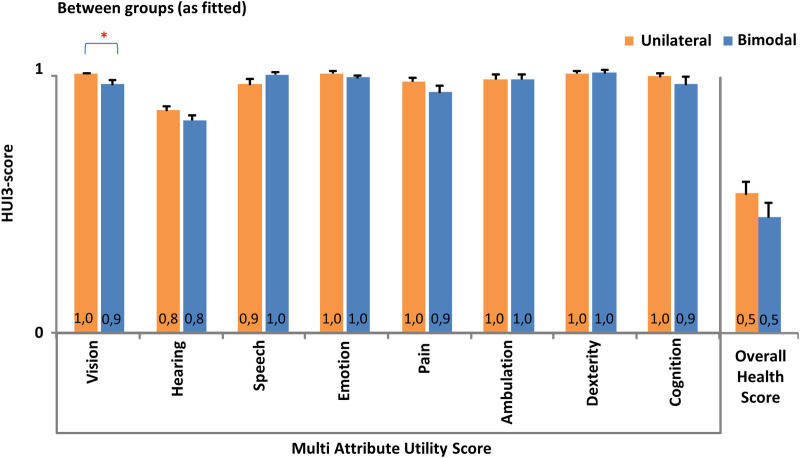
Fig 5. HUI3.
Health related Quality of Life ratings for subjects who only use a cochlear implant (CI) (unilateral group, n = 21) and subjects who also use a hearing aid (HA) in the non-implanted ear (bimodal group, n = 26). Pooled mean (+standard error) multi attribute utility scores across health related subscales and the pooled mean (+standard error) overall health utility score are determined using the HUI3 questionnaire by Grutters et al. [45]. Asterisks denote significant differences between both groups (*p<0.05).

