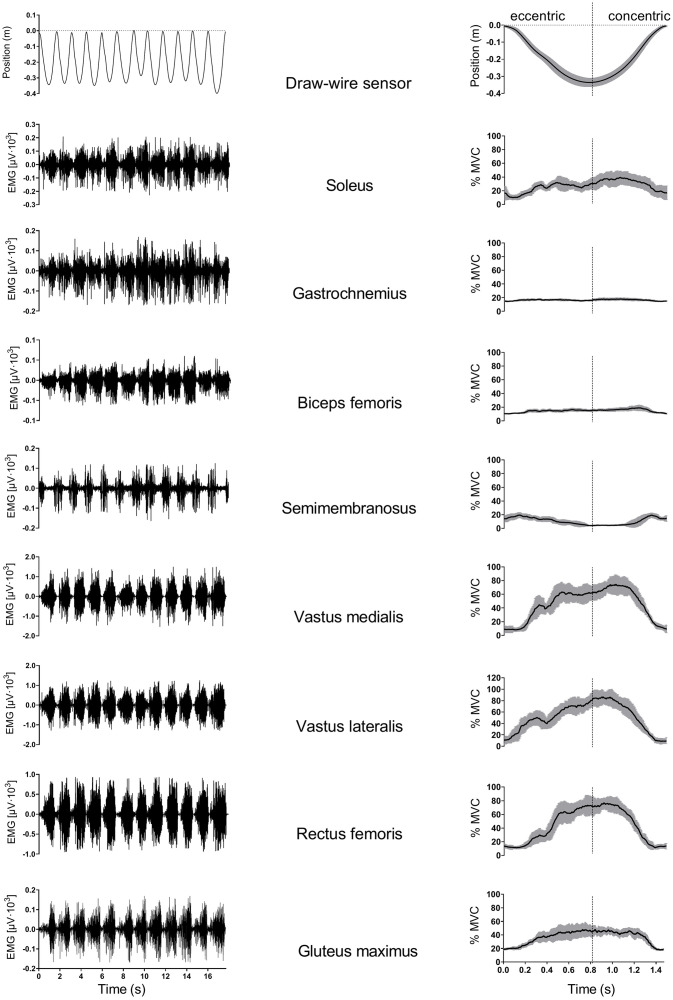
Fig 2. Representation of typical raw and processed vertical position and EMG signal.
Data are presented for 12 consecutive squat repetitions at the 0.225 kg∙m2 load. The first row represents raw (left) and processed (right) position data. In rows 2–8 raw (left) and processed (right) EMG signals for eight muscles are presented. Repetitions were determined from position data cycles, starting at the highest (approximately 0° knee angle) going through the lowest (approximately 90° knee angle) position and stopping at the highest vertical position. Position data for 12 consecutive repetitions was later time-domain normalized and superimposed (first row, right column). EMG data were firstly filtered and then rectified using root mean square (RMS) function (100 ms) and expressed as a percentage of peak EMG activity during MVC trials (%MVC). Average values (solid line) and standard deviations (grey area) for 12 consecutive time-normalized and superimposed traces are presented in the right column. The concentric area represents the propulsive (concentric) movement and the eccentric area represents braking (eccentric) movement while executing the squat.

