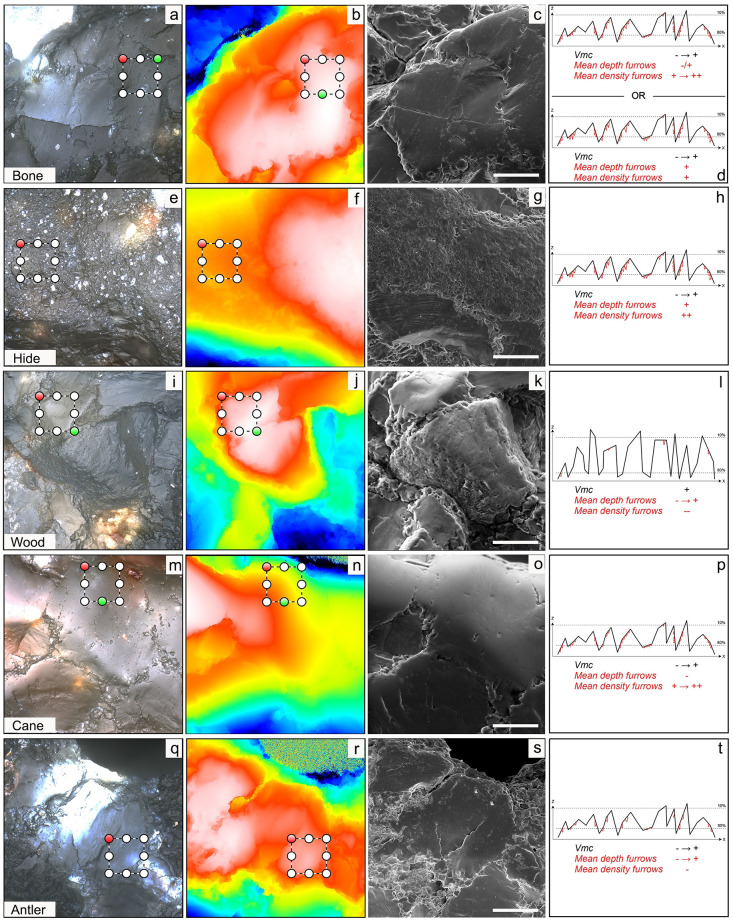
Fig 7. Bright field images (left), topographies (middle-left), SEM images (middle-right) and schematic representations (right) of the textures characteristic (based on the decision tree; Fig 4) of the different worked materials.
For simplicity, the schemes show X-Z profiles, in black, with furrows superimposed in red. Vmc is calculated as the volume below the surface (= area below the XZ profile) and between the dashed lines. Note that the scales are not preserved and that the values are to be considered only in relative terms among the schemes. When a range is given for a parameter (e.g. "- → +" for Vmc on antler), it means that the values can vary within the given range. When the range include the extreme values (e.g. "- → +" for Vmc), it means that this parameter is not characteristic for this worked material. See Table 4 for the values of the selected parameters for each surface.

