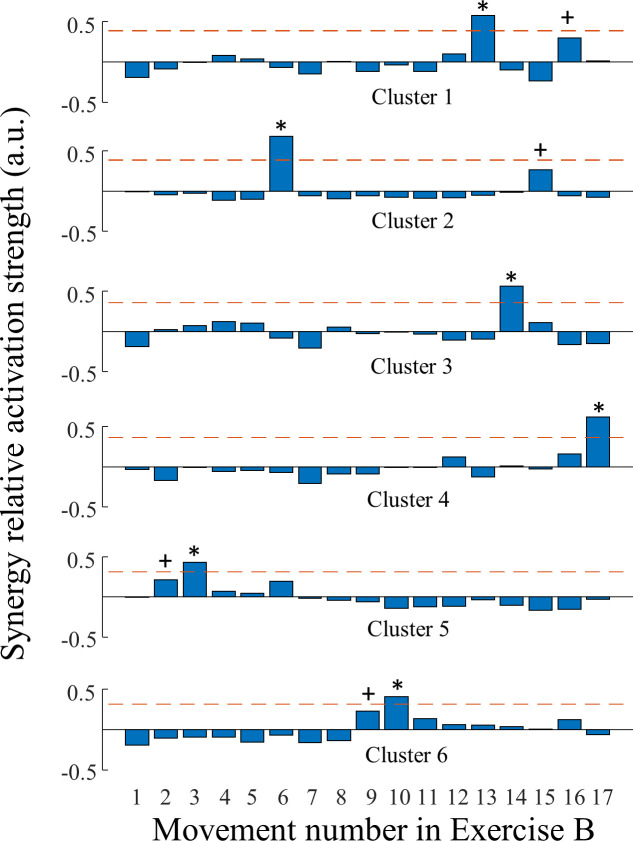
Fig 3. Activation strength of synergy types extracted from able-bodied subjects.
Each row represents the relative activation strength for movements from Exercise B, averaged within a cluster of normalized synergies. The dashed horizontal lines represent the Mean + 2 S.D. of these averaged activation strength. The asterisks and crosses indicate the primary and secondary representative movements for the synergy clusters. The movement number is defined in Table 2 Exercise B.

