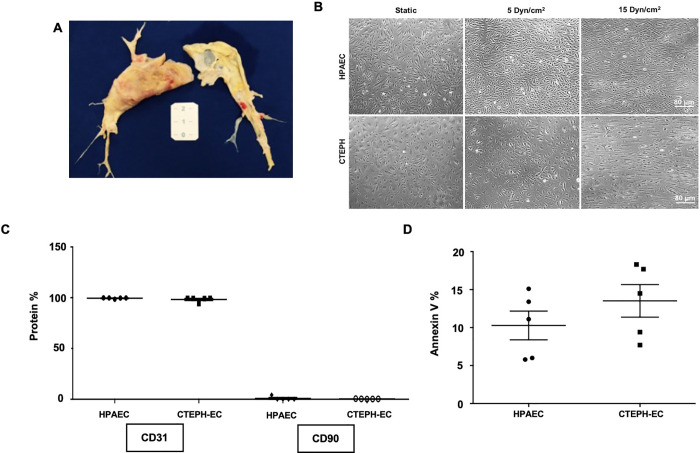
Fig 1. Characterization of endothelial cells from CTEPH patient.
(A). Representative image from PEA samples. (B) Images of HPAEC and CTEPH-EC in static condition and after exposition to low (5 dynes/cm2) and high shear stress (15 dynes/cm2). (C) Flow cytometry analyses of CD31 and CD90 expression in HPAEC and CTEPH-EC (n = 5). (D) Annexin V quantification of HPAEC and CTEPH-EC in static condition (n = 5).

