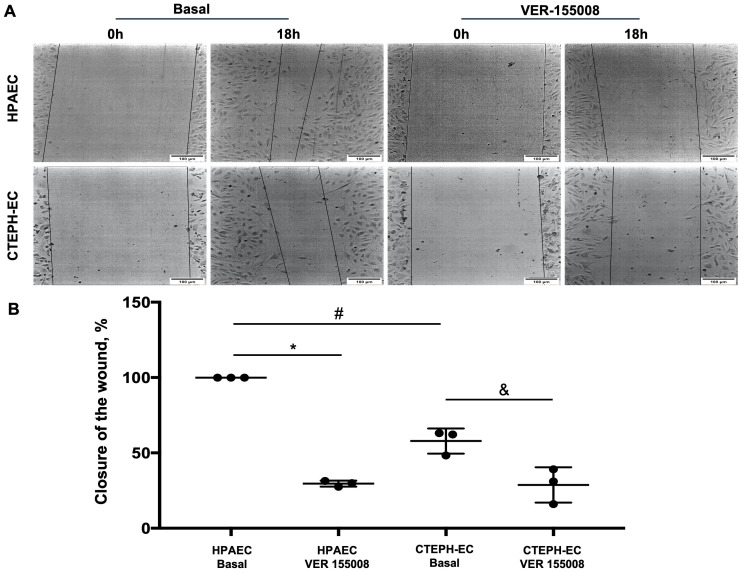
Fig 5. Migration capacity of HPAEC and CTEPH-EC in basal and with HSP70 inhibitor VER-155008.
(A) Representative images of HPAECs and CTEPH-ECs basal and after VER-155008. (B) Quantification of the migration. Data are presented as the mean ± standard error: (*) HPAEC Basal vs HPAEC VER, (#) HPAEC Basal vs CTEPH-EC Basal, (&) CTEPH-EC Basal vs CTEPH-EC VER, P < 0.05. (n = 3).

