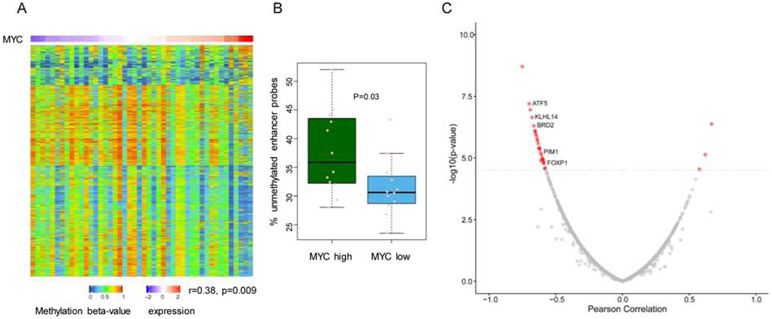
Figure 6. MYC expression, enhancer methylation and activity in primary DLBCL.
a) Heat map of enhancer methylation in primary DLBCL assembled according to their MYC expression (top row). Each column is one tumor (n=46) and each row an enhancer probe (n=3000). b) comparison of the percentage of unmethylated enhancer probes in primary DLBCL mapped to the top and bottom quantiles of MYC expression. c) volcano plot depicting the relationship between enhancer methylation and target gene expression in primary DLBCL; genes with a highly significant correlation are in red, and representative examples of those with known role in lymphoma biology labeled. P value in a) is from Pearson correlation. In b) all data points are shown (min to max) and the p value is from a two-tailed Student’s t-test.

