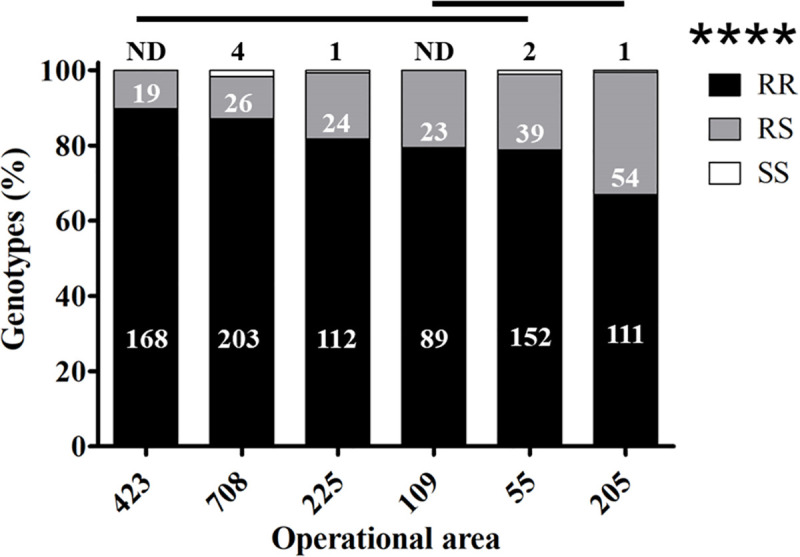
Fig 8. Percent of each genotype (RR, RS, and SS) of Cx. quinquefasciatus from per area.

**** P < 0.0001 calculated by Chi-square. Horizontal lines above bars indicate the areas which are not significantly different (P < 0.05). The numbers in the graph refer to the numbers of mosquitoes analyzed for each area: in black on the top of each bar are the number of susceptible (SS) mosquitoes; ND = non-detected susceptible mosquitoes; in white in the gray boxes are the number of heterozygous resistant (RS), and in white in black boxes are the number of homozygous resistant (RR).
