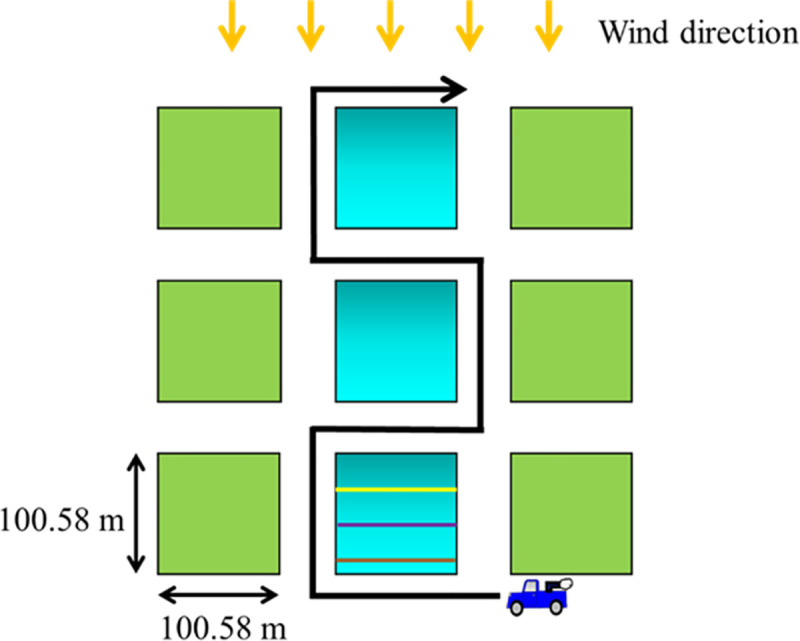
Fig 12. Schematic of pesticide application route in Harris County.

The average length of blocks (colored squares) in Houston is 100.58 m. The orange arrows indicate the wind direction. The black single arrow line shows the route of the pesticide application truck. The green squares are the blocks that have not received pesticide application. The squares with blue gradient are the blocks that have received the pesticide application; based on the bioassays results, the darker blue region receives more pesticide droplets than the lighter blue region. The three different colored lines in the gradient blue block indicates the three different distances, 30.4 (yellow line), 60.8 (purple line), and 91.4 (brown line) meters, from the pesticide application source.
