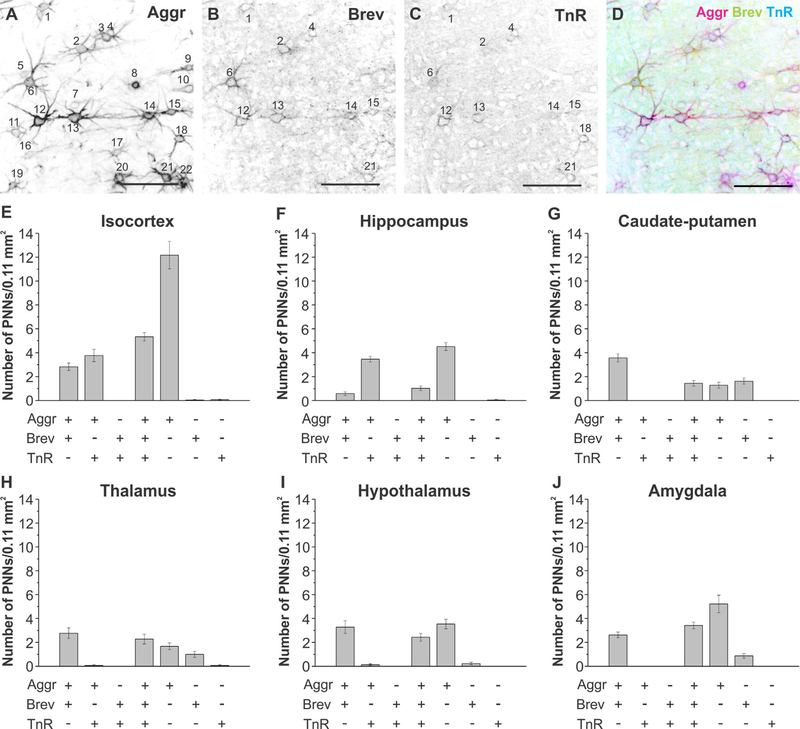
Figure 13.
Colocalization analyses of aggrecan, brevican, and tenascin-R in distinct brain regions. A–D: Black and white single channel and merge image of aggrecan-, brevican-, and tenascin-R-positive perineuronal nets. Perineuronal nets were counted in each image, and colocalization was determined. In the depicted images perineuronal nets 1, 2, 4, 6, 12, 13, 14, 15, and 21 are positive for aggrecan, brevican, and tenascin-R, whereas all other nets were positive only for aggrecan. E–J: Colocalization analyses for the (E) isocortex, (F) hippocampus, (G) caudate-putamen, (H) thalamus, (I) hypo-thalamus, and (J) amygdala are depicted. Error bars are shown as standard error of the mean (SEM). Significance levels calculated by ANOVA (Bonferroni post hoc test) are shown in Table 2E. n = 39 images, 18 slices, 3 brains. Abbreviations: Aggr, aggrecan; Brev, brevican; TnR, tenascin-R. Scale bar = 100 μm in E–D.

